Archetype 4: Sequence – timeline of activities
This archetype is used to communicate the order between activities against a linear/calendar timeline. The editable PowerPoint files for the examples of this archetype are provided at the end of this chapter for you to use and adapt, along with annotated versions of the archetypes to show the key elements in their design.
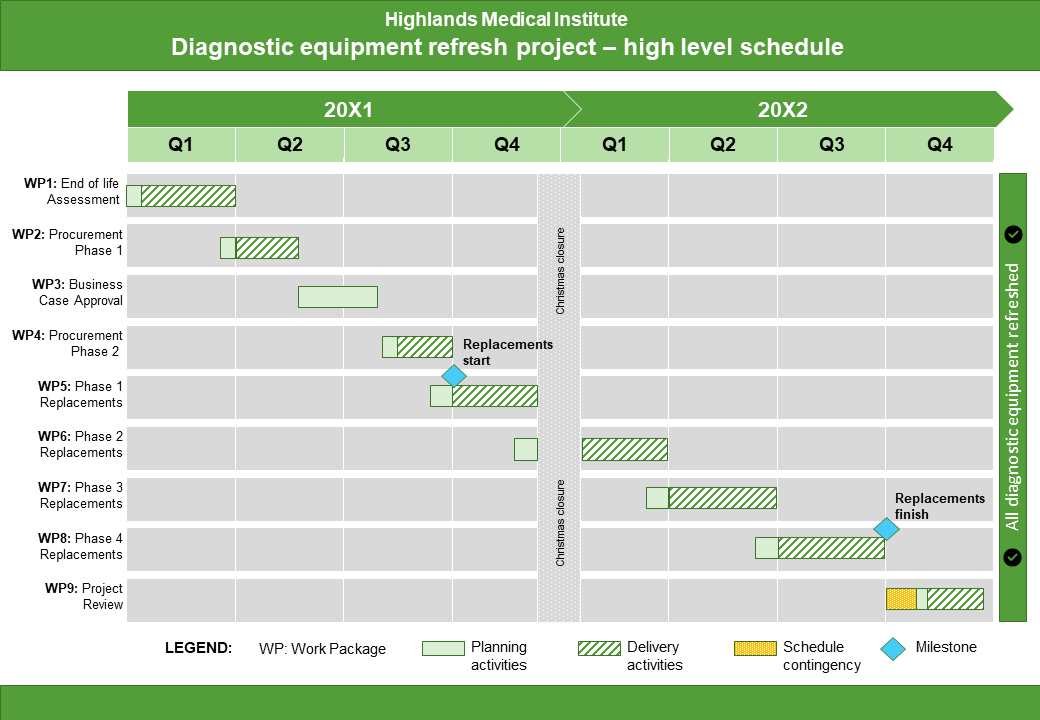
Example A: Sequence – timeline of activities
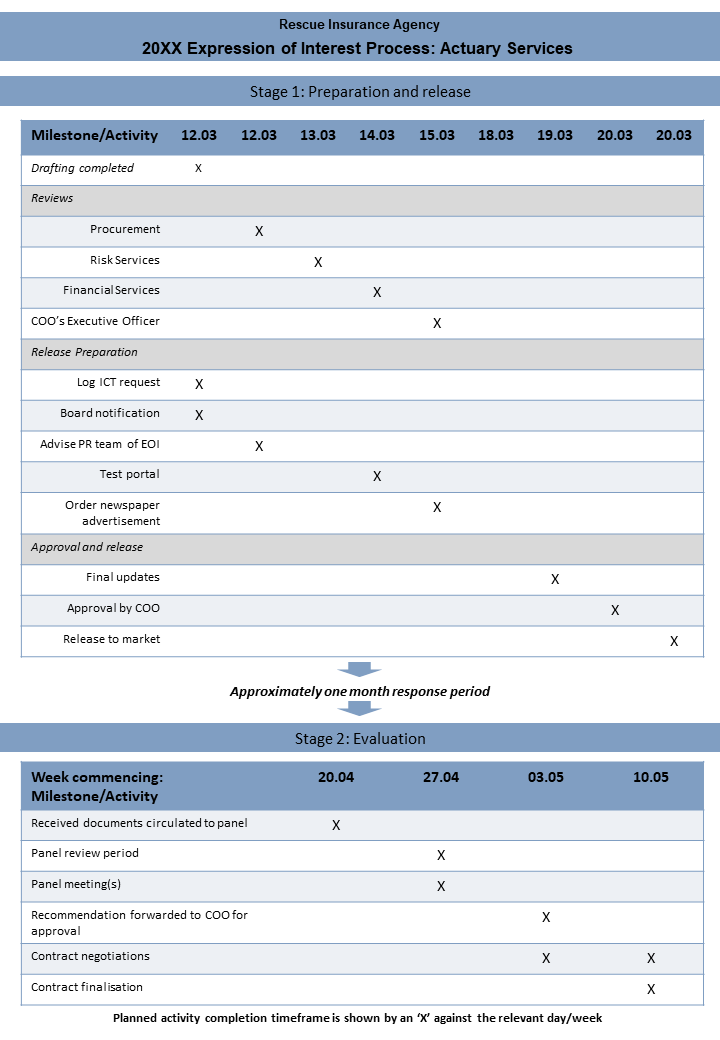
Example B: Sequence – timeline with activities
Guidelines for tailoring the archetype
| Archetype | Sequence - timeline of activities |
|---|---|
| Purpose | This visual archetype is used to communicate the order between activities against a linear/calendar timeline. This may include: • the order of tasks within a work package • the order of a group of work packages or activities within a project • the order of projects in a program or portfolio This archetype is similar to a Gantt chart but is designed for readability and is generally a higher level view than a detailed Gantt chart. |
| Information you will need | • What are the tasks/ activities/ projects that you want to show? • What are the start/finish times of each task/ activity/ project? • If there are any subtasks within each task/ activity/ project, when do they start/finish? (Optional) • Any milestones associated with the activities |
| Tips | • Try to compare a moderate or large number of tasks/ activities/ projects: 6 - 12 is best • The overall duration of all tasks/ activities/ projects will determine the accuracy of date representation - for example, if you are showing a four year period, you will probably only be able to divide your timeline into quarters |
| Page layout | • Either landscape or portrait is possible • Best choice will depend on the duration of all activities versus the number of activities to be shown. Use landscape if you have a moderate number of tasks over a longer duration. Use portrait if you have a moderate to large number of tasks over a short duration. • Timeline is always across the top of the page and the tasks/ activities/ projects are rows going down the page • The tasks in their rows will be ordered according to their start date • The tasks/ activities/ projects may be grouped for readability |
| Text | • The timeline will require labels along the top of the page, such as years, quarters, months, weeks or days • Each task/ activity/ project will require a label, likely to be on the left-hand side of the page |
| Imagery | • Represent the duration of each task/ activity/ project with a line or long box in the relevant position on the timeline • Milestones (if used) are commonly represented with a diamond shape • If you are showing sub-tasks in an activity, you may divide up the line or rectangle shape |
| Colour | • Consider using one or two colours for the decorative areas on the page and for the headings • Select a colour or pattern type to indicate various types of tasks within an activity/ project (Optional) • Ensure that any colours/patterns have purpose - there's no benefit to using a different colour for each task/ activity/ project |
| Legend | Use a legend for: • the meaning of any shapes, e.g. rectangles or diamonds • the meaning of any colours/patterns/icons • abbreviations |
| Notes | • If you want to highlight hard dependencies between tasks/ activities/ projects, you can use a line to link the rectangles - make sure you explain this meaning in your legend. • You may choose to add the overall objective or vision at the end of the timeline |
Example A: Sequence – timeline with activities (with annotations)
Click the blue information buttons on the diagram below to see annotations explaining the reasons for choosing these visual elements.
Example B: Sequence – timeline with activities (with annotations)
Click the blue information buttons on the diagram below to see annotations explaining the reasons for choosing these visual elements.
‘Sequence – timeline with activities’ templates
The templates shown above are freely available for you to use and adapt. You can download them using the links below:
