Archetype 10: Comparison of relative values
This visual archetype plots two variables associated with a set of concepts against an x and y axis in a grid. The editable PowerPoint files for the examples of this archetype are provided at the end of this chapter for you to use and adapt, along with annotated versions of the archetypes to show the key elements in their design.
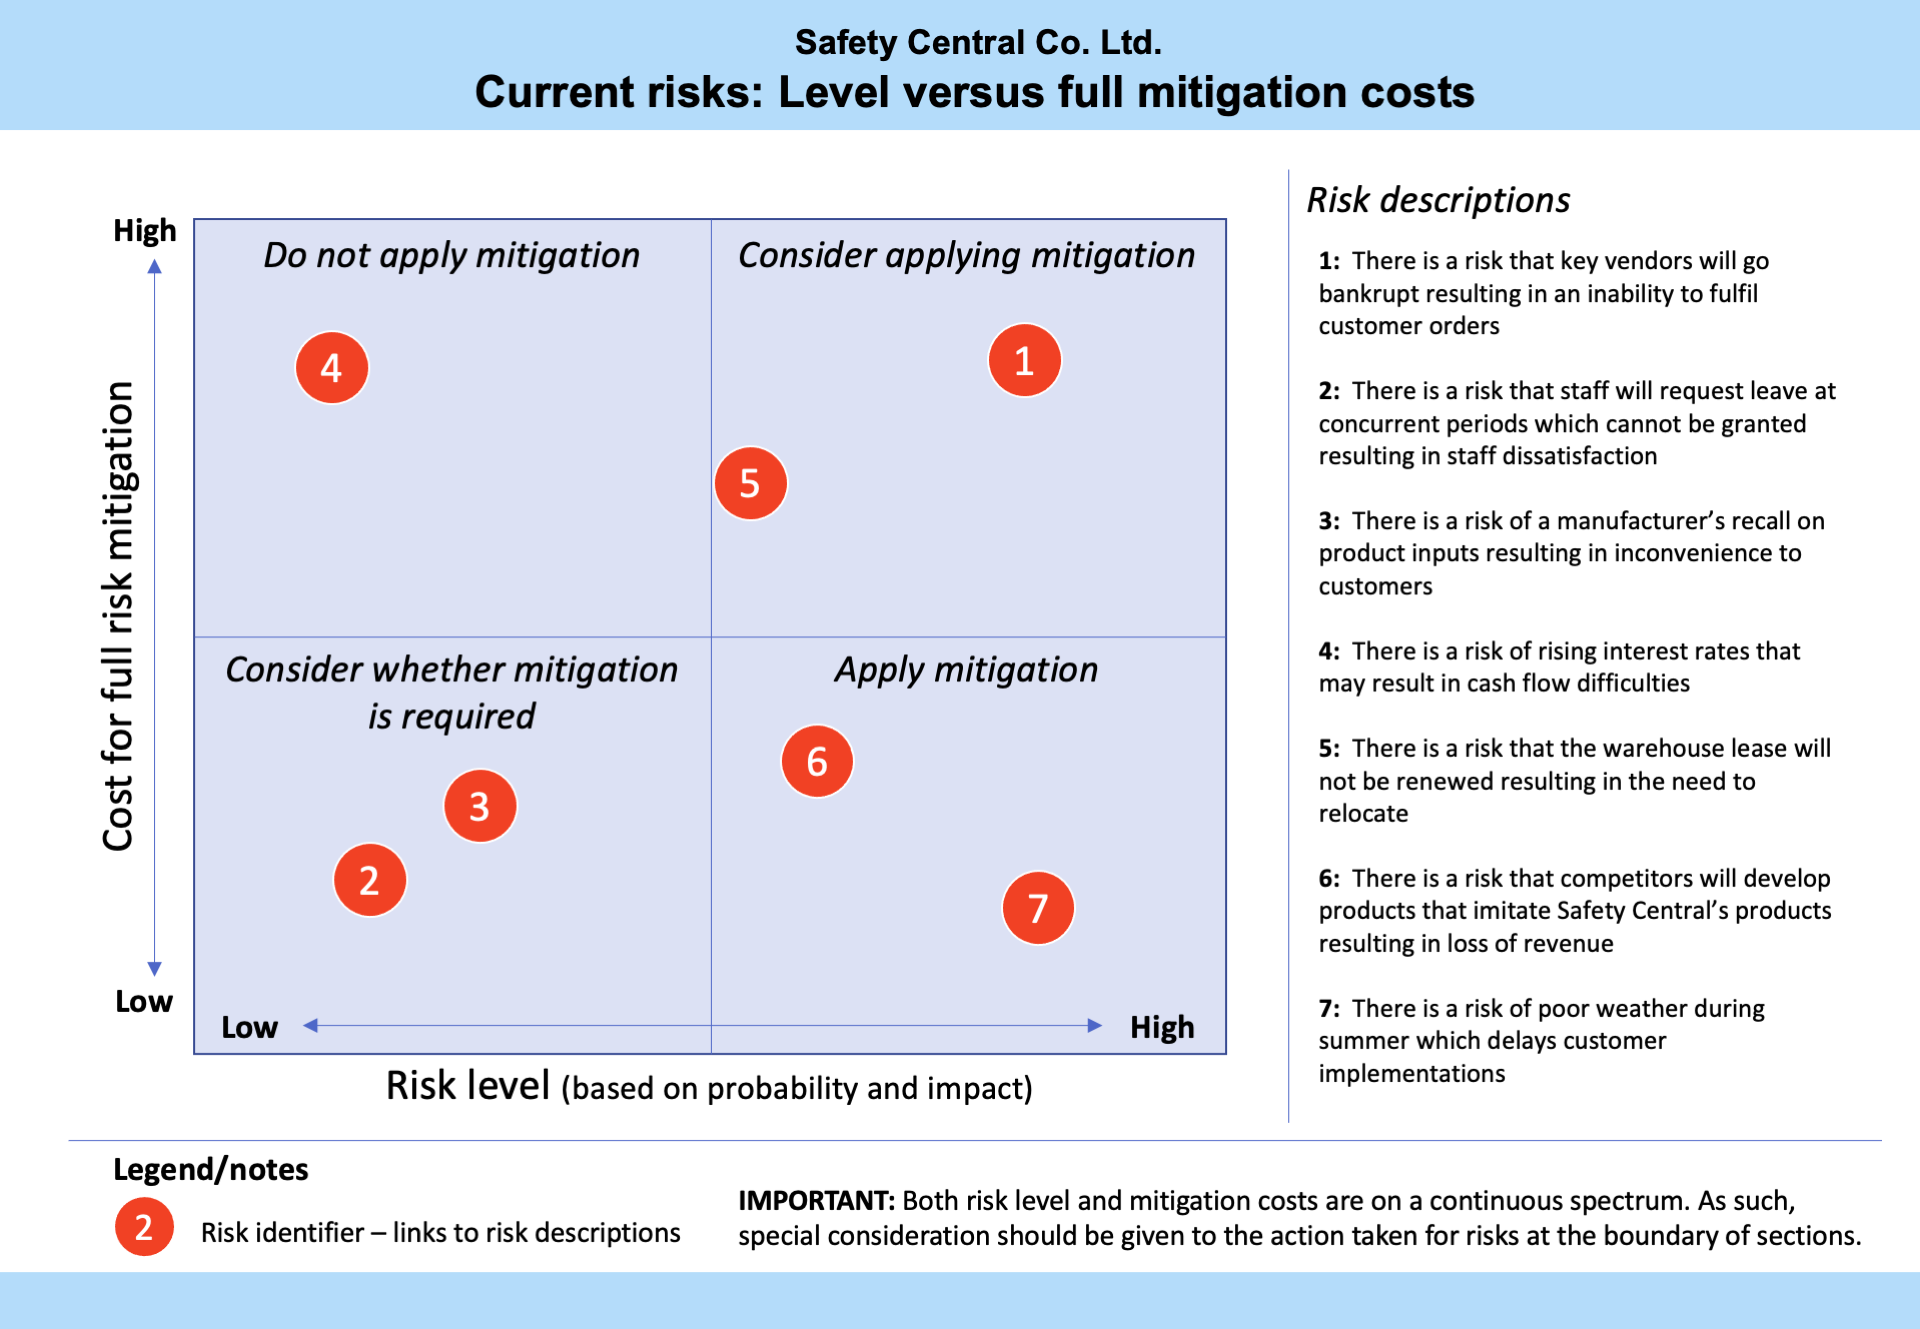
Example A: Comparison of relative values
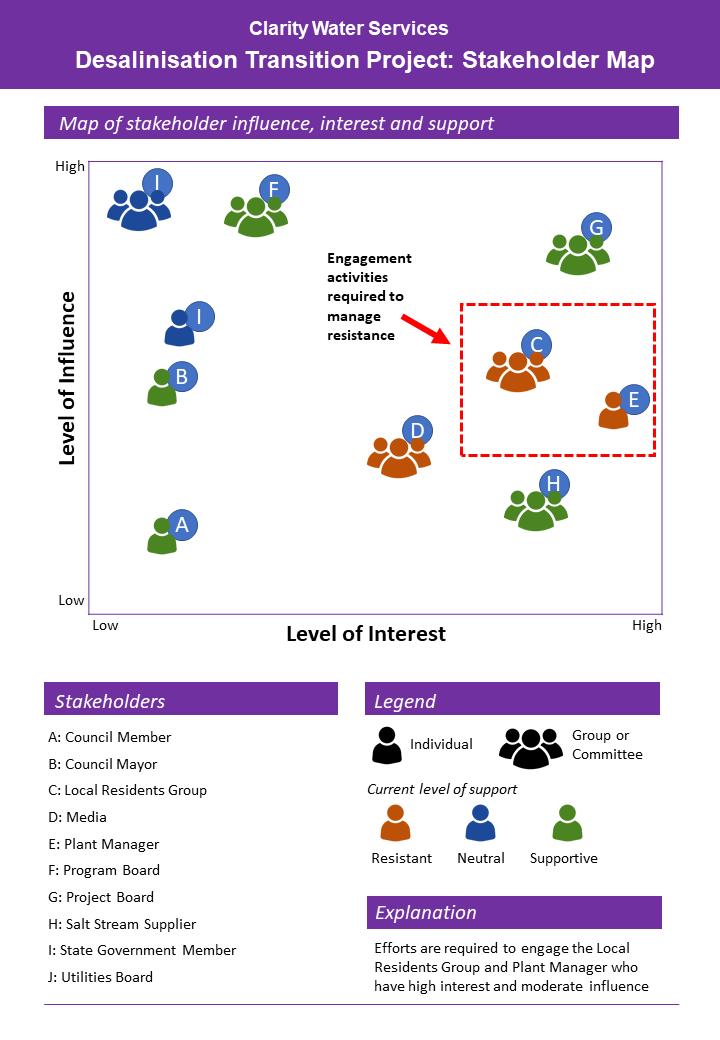
Example B: Comparison of relative values
Guidelines for tailoring the archetype
| Archetype | Comparison of relative values |
|---|---|
| Purpose | This visual archetype plots two variables associated with a set of concepts against an x and y axis in a grid. It is similar to a 2 x 2 matrix. Uses may include plotting: • a project’s risks in terms of probability versus impact (or other variables) • a program’s projects in terms of cost versus benefits (or other variables) • stakeholder’s interest versus influence/power in relation to a project |
| Information you will need | • The list of concepts (e.g. projects, risks, stakeholders, etc.) to compare • The two (or more – refer to the Tips below) variables that you are comparing for each concept |
| Tips | You can have additional variables (up to 4) that you can represent through shape and colour, for example: • x axis placement: risk probability • y axis placement: risk impact • colour: type of risk (business, client etc.) • shape (rectangle versus circle) or iconography: risk has been treated versus risk has not been treated |
| Page layout | • Either landscape or portrait is possible • If portrait, the description list for the concepts will likely be at the bottom of the grid • If landscape, the description list for the concepts will likely be to the side of the grid |
| Text | • Ensure that each concept is given a description (to the side or below the grid) • Axis to be labelled with the variable they represent and with an indication of the spectrum (e.g. high versus low) |
| Imagery | • Plot the concepts on a square grid • Each concept is represented as a shape (a circle is standard) • You may choose to create a 2 x 2 matrix with lines |
| Colour | • There is no specific use of colour for this archetype • Often a light colour will be useful for the background grid • Different colours may be used to colour the shape of the plotted concepts if more than two variables are being shown |
| Legend | Use a legend for: • explaining any variables beyond the x and y axes • any notes/cautions/assumptions regarding the plot |
| Notes | • Be cautious with lines that create the 2 x 2 matrix - often variables are continuous and if a concept is on the edge of a matrix line the required action/classification may require review |
Example A: Comparison of relative values (with annotations)
Click the blue information buttons on the diagram below to see annotations explaining the reasons for choosing these visual elements.
Example B: Comparison of relative values (with annotations)
Click the blue information buttons on the diagram below to see annotations explaining the reasons for choosing these visual elements.
‘Comparison of relative values’ templates
The templates shown above are freely available for you to use and adapt. You can download them using the links below:
Please note: The icons in Example B are sourced from Noun Project and are licensed under a Creative Commons Attribution licence:
- Individual person: Person by Alice Design
- Group: Team by Creative Stall
