Archetype 6: Reasons and drivers
This archetype is used to communicate why something has arisen or is required. The editable PowerPoint files for the examples of this archetype are provided at the end of this chapter for you to use and adapt, along with annotated versions of the archetypes to show the key elements in their design.
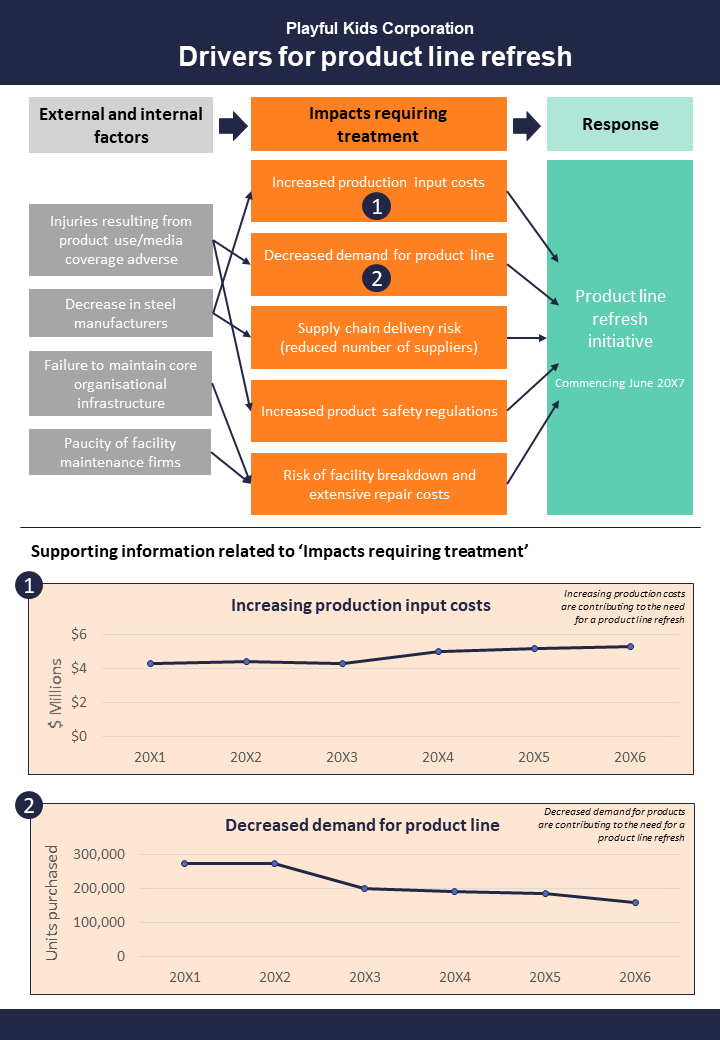
Example A: Reasons and drivers
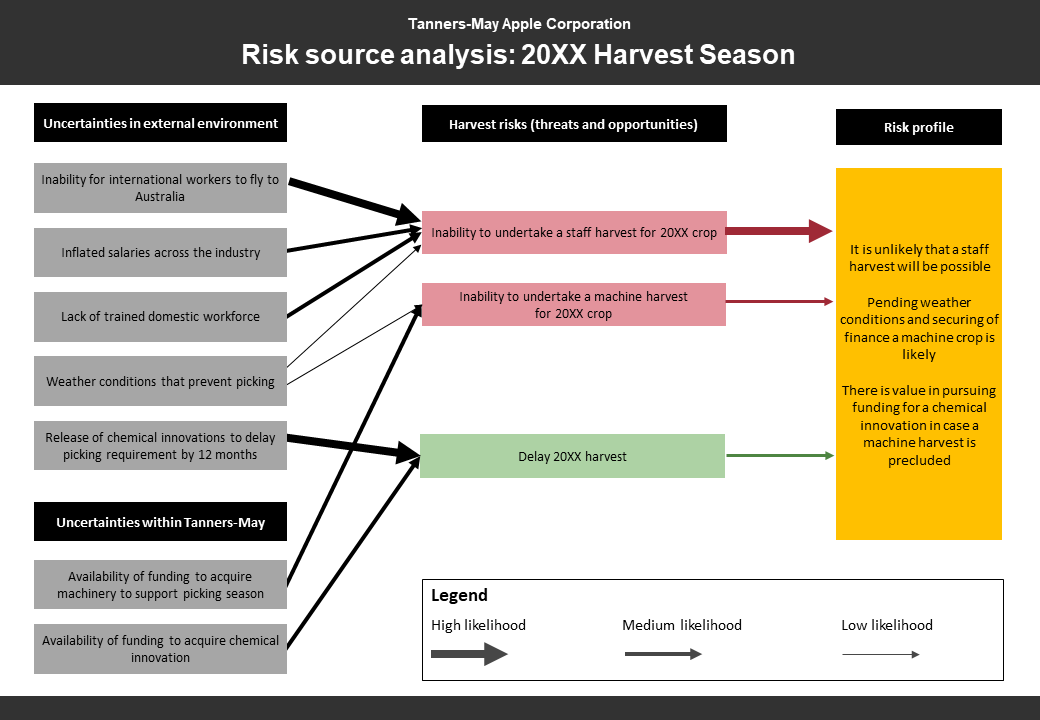
Example B: Reasons and drivers
Guidelines for tailoring the archetype
| Archetype | Reasons and drivers |
|---|---|
| Purpose | This visual archetype is used to communicate why something has arisen or is required. This may include: • the drivers or reasons for an initiative being undertaken (why it is necessary) • why a risk or issue has arisen This archetype is similar in visual structure to a benefits dependency map. |
| Information you will need | • The outcome that you want to explain (e.g. the initiative, risk or issue) • The drivers/influences/factors that have caused/are causing the risk/issue or need for the initiative • There may be multiple layers (hierarchy) of drivers/influences/factors that you want to communicate • If you do have multiple layers (hierarchy) you will need to know how they relate/link |
| Tips | • If you are using multiple layers of reasons, consider the sequence in which they occur (inform/influence one another) - these will be your columns. • You may use this visual archetype with other visual archetypes to create a single page visual (i.e. it may be used in combination with other visual archetypes) |
| Page layout | • Either landscape or portrait may be possible depending on the number of drivers/influences/factors and any layers and whether you are coupling this archetype with other archetypes on a single page • Drivers/influences/factors are to the left flowing to the right • The initiative/risk/issue is on the far right |
| Text | • Any layers will require a heading for the group of drivers/influences/factors • Each driver/influence/factor and initiative/risk/issue will require a label |
| Imagery | • Represent each driver/influence/factor and initiative/risk/issue as a rectangle (or other shape) • Vertically align drivers/influences/factors in a layer in a column • Use arrows to indicate the links between layers in your diagram |
| Colour | • Consider using colour to indicate favourable (green) versus unfavourable (red or orange) elements in the drawing - for example, orange/red rectangles for problems that require a solution and a green rectangle for the initiative that provides the solution to the problems |
| Legend | • A legend is not likely to be required for this visual archetype unless abbreviations are being used in the labels |
| Notes | • Consider using another visual archetype or chart to explain drivers/influences/factors in your diagram |
Example A: Reasons and drivers (with annotations)
Click the blue information buttons on the diagram below to see annotations explaining the reasons for choosing these visual elements.
Example B: Reasons and drivers (with annotations)
Click the blue information buttons on the diagram below to see annotations explaining the reasons for choosing these visual elements.
‘Reasons and drivers’ templates
The templates shown above are freely available for you to use and adapt. You can download them using the links below:
