Section 9.4: Comparing Two Dependent Conditions or Paired Samples – Wilcoxon Sign-Rank Test
Learning Objectives
At the end of this section you should be able to answer the following questions:
- How would you interpret a Wilcoxon Sign-Rank Test?
- How is a Wilcoxon Sign-Rank Test related to the size of the differences in scores?
The Wilcoxon Test for Paired Samples
When examining within groups differences, Wilcoxon Signed Ranks Test is best. This test examines the differences in scores, as well as the size of the differences.
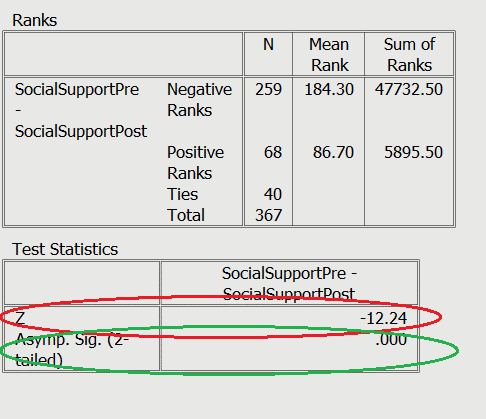
Example: The levels of perceived social support a group of Australians reported before engaging with a social skills building program and after completing the program.
Interpretation of the Wilcoxon Test
Using the same example from the t-test module, the levels of perceived social support a group of Australians reported before engaging with a social skills building program and after completing the program. As can be seen in red, the Z score, and in green the p value. These indicate that there is a difference in median pre- vs post-test rank score. The scores appear to improve from time 1 to time 2, which we can infer by the negative Z score, and the number of positive ranks in time 2.
Write-up
An example write up: A Wilcoxon Sign-Rank Test indicated that median post-test ranks for social support were statistically significantly higher than the pre-test ranks (Z = -12.24, p <.001).
PowerPoint: Wilcoxon Test
Please click on the slides below to see an example of interpretation for the Wilcoxon Sign-Rank Test.
