Section 8.5: EFA Interpretation
Learning Objectives
At the end of this section you should be able to answer the following questions:
- How do we assign a name or label to factors?
- How many variables or items can be recommended per factor?
Pattern Matrix & Structure/Factor Matrix
The next piece of information is the pattern and the structure matrixes. These provide useful information on the factor loadings of the items. The pattern matrix shows the unique contribution of a variable to a factor, and is generally simpler to interpret. The structure matrix shows the shared variance that is ignored in the pattern matrix, and is more complicated to interpret. Note: Jamovi automatically produces the pattern matrix.
PowerPoint: Matrices
Please have a look at the below output for a Pattern Matrix:
Number of Variables per Factor
The replicability and strength of a component are determined by the number of variables per factor/component. A good rule is that a minimum of 4 variables is recommended per factor. All items that load on to factor should have a score of greater than .40 on the pattern matrix. Just be aware that items can “crossload” (i.e. have scores great than .40 on more than one factor).
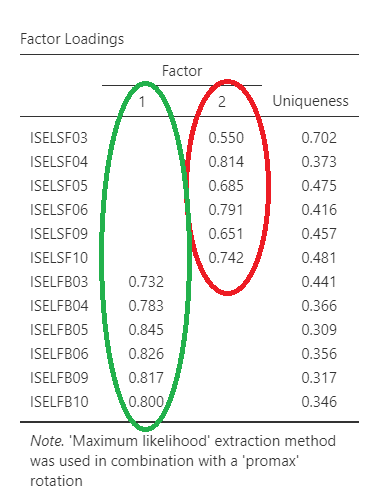
Pattern Matrix
As you can see on the output, the pattern matrix clearly shows the loadings of each item onto the two factors. The two factors show that there are siz items for each, with one factor measuring in-person support, and the other Facebook-based support. This makes sense, both statistically, and theoretically. It is important to note that this is an optimal factor loading as there are two distinct factors, with no poor loadings (i.e. < .40) and crossloadings (have scores great than .40 on more than one factor). If there were any poor loadings/crossloadings, these items would be removed for the next round of EFAs.
Interpretation of Factors/Components
When naming the factors found it is usual to characterise the factor by assigning a name or label related to the semantic topic the items measure. This involves not only the knowledge of the area (science) but is an artistic pursuit sometimes. For this example we would have one factor labeled in-person support, and the other Facebook-based support. And we can see that they have a moderate correlation with each other.
