Section 4.2: Correlation Assumptions, Interpretation, and Write Up
Learning Objectives
At the end of this section you should be able to answer the following questions:
- What assumptions should be checked before performing a Pearson correlation test?
- What is the relationship between correlation and causation?
Correlation Assumptions
There are four assumptions to check before performing a Pearson correlation test.
- The two variables (the variables of interest) need to be using a continuous scale.
- The two variables of interest should have a linear relationship, which you can check with a scatterplot.
- There should be no spurious outliers.
- The variables should be normally or near-to-normally distributed.
Correlation Interpretation
For this example will be looking at two relationships: levels of physical illness and mental distress, and physical illness and life satisfaction.
PowerPoint: Correlation Output
Have a look at the following slides while you are reviewing this chapter:
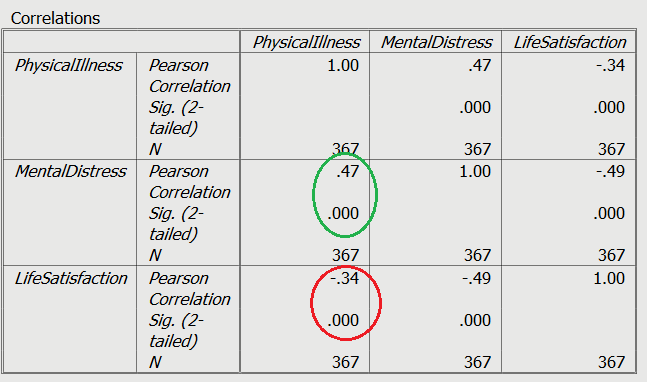
As you can see from the output (circled in green), the relationship between physical illness and mental distress is both a positive and statistically significant. As a person reports higher levels of physical illness, they are more likely to report higher levels of mental distress. The reverse is true of the relationship between physical illness and life satisfaction, with these showing a significant negative relationship (shown in red). The greater levels of physical illness, the more likely the person is to have lower levels of life satisfaction. Both relationships are significant (see p values) and are medium in strength.
Although we have two significant relationships or associations between these variables, it does not mean that one variable causes the other. Researchers need to remember that there may be third variable (or covariates) present that affects both variables accounted for in a correlation coefficient. Therefore, the existence of a significant correlation coefficient for a pair of variables by itself does not imply causation between the two variables.
Correlation Write Up
A write-up for a Correlation Analyses should look like this:
Among Australian Facebook users, the levels of reported physical illness and mental distress showed a medium positive relationship, r(366) = .47, p < .001, whereas the levels of physical illness and life satisfaction showed a medium negative relationship, r(366) = -.34, p < .001.
