2.5 Projection Coordinates
Although computing power has made it much easier to model 3D shapes like the Earth, this hasn’t always been the case. For almost as long as humanoid species have existed, we have captured location information in the only way available to us – a two dimensional map format.
Cartography, the practice of making maps, has long needed methods to represent the 3D size and shape of the Earth on a 2D surface like paper, and it achieves this using models called map projections.
Map projections use the idea that a 2D surface can be manipulated to wrap around, and intersect or touch a sphere or ellipsoid, and then points can be ‘projected’ outwards from the sphere or ellipsoid onto the 2D surface.
This is easier to visualise with an example…
Imagine if you could put a torch inside a model of the Earth that shone in 360°, and then made pinpricks around the coastlines of all the countries. You then wrapped a piece of paper around the equator of the model like a cylinder, and drew a dot everywhere a dot of light landed on the paper. When you unwrapped the paper and lay it flat, you would have a representation, or map, of all of the coastlines on the Earth. Congratulations! You have used a cylindrical projection to transform three dimensional coordinates (positions on a globe) to a two dimensional system (a paper map).
Representing a 3D surface on a 2D surface isn’t without its problems though, as you move further away from where the 2D surface touches or intersects with the 3D surface, the distortion of distance, shape and area becomes larger and larger.
In our example above, the pinpricks that are closest to the equator are going to going to appear on the paper relatively close to where they are on the globe, and their distance, shape and area will be pretty close to reality. However, when we move closer to the poles, the distance from the pinprick to the paper is much larger, so the distances, shape and area of the coastlines are all going to be grossly exaggerated. This is exactly what happens on most world maps that use a cylindrical map projection – countries near the pole look much larger than they are in reality.
Types of projections
There are three main types of projections; cylindrical, conical and plane. Other types exist, but these are the most common for mapping purposes.
Cylindrical projections
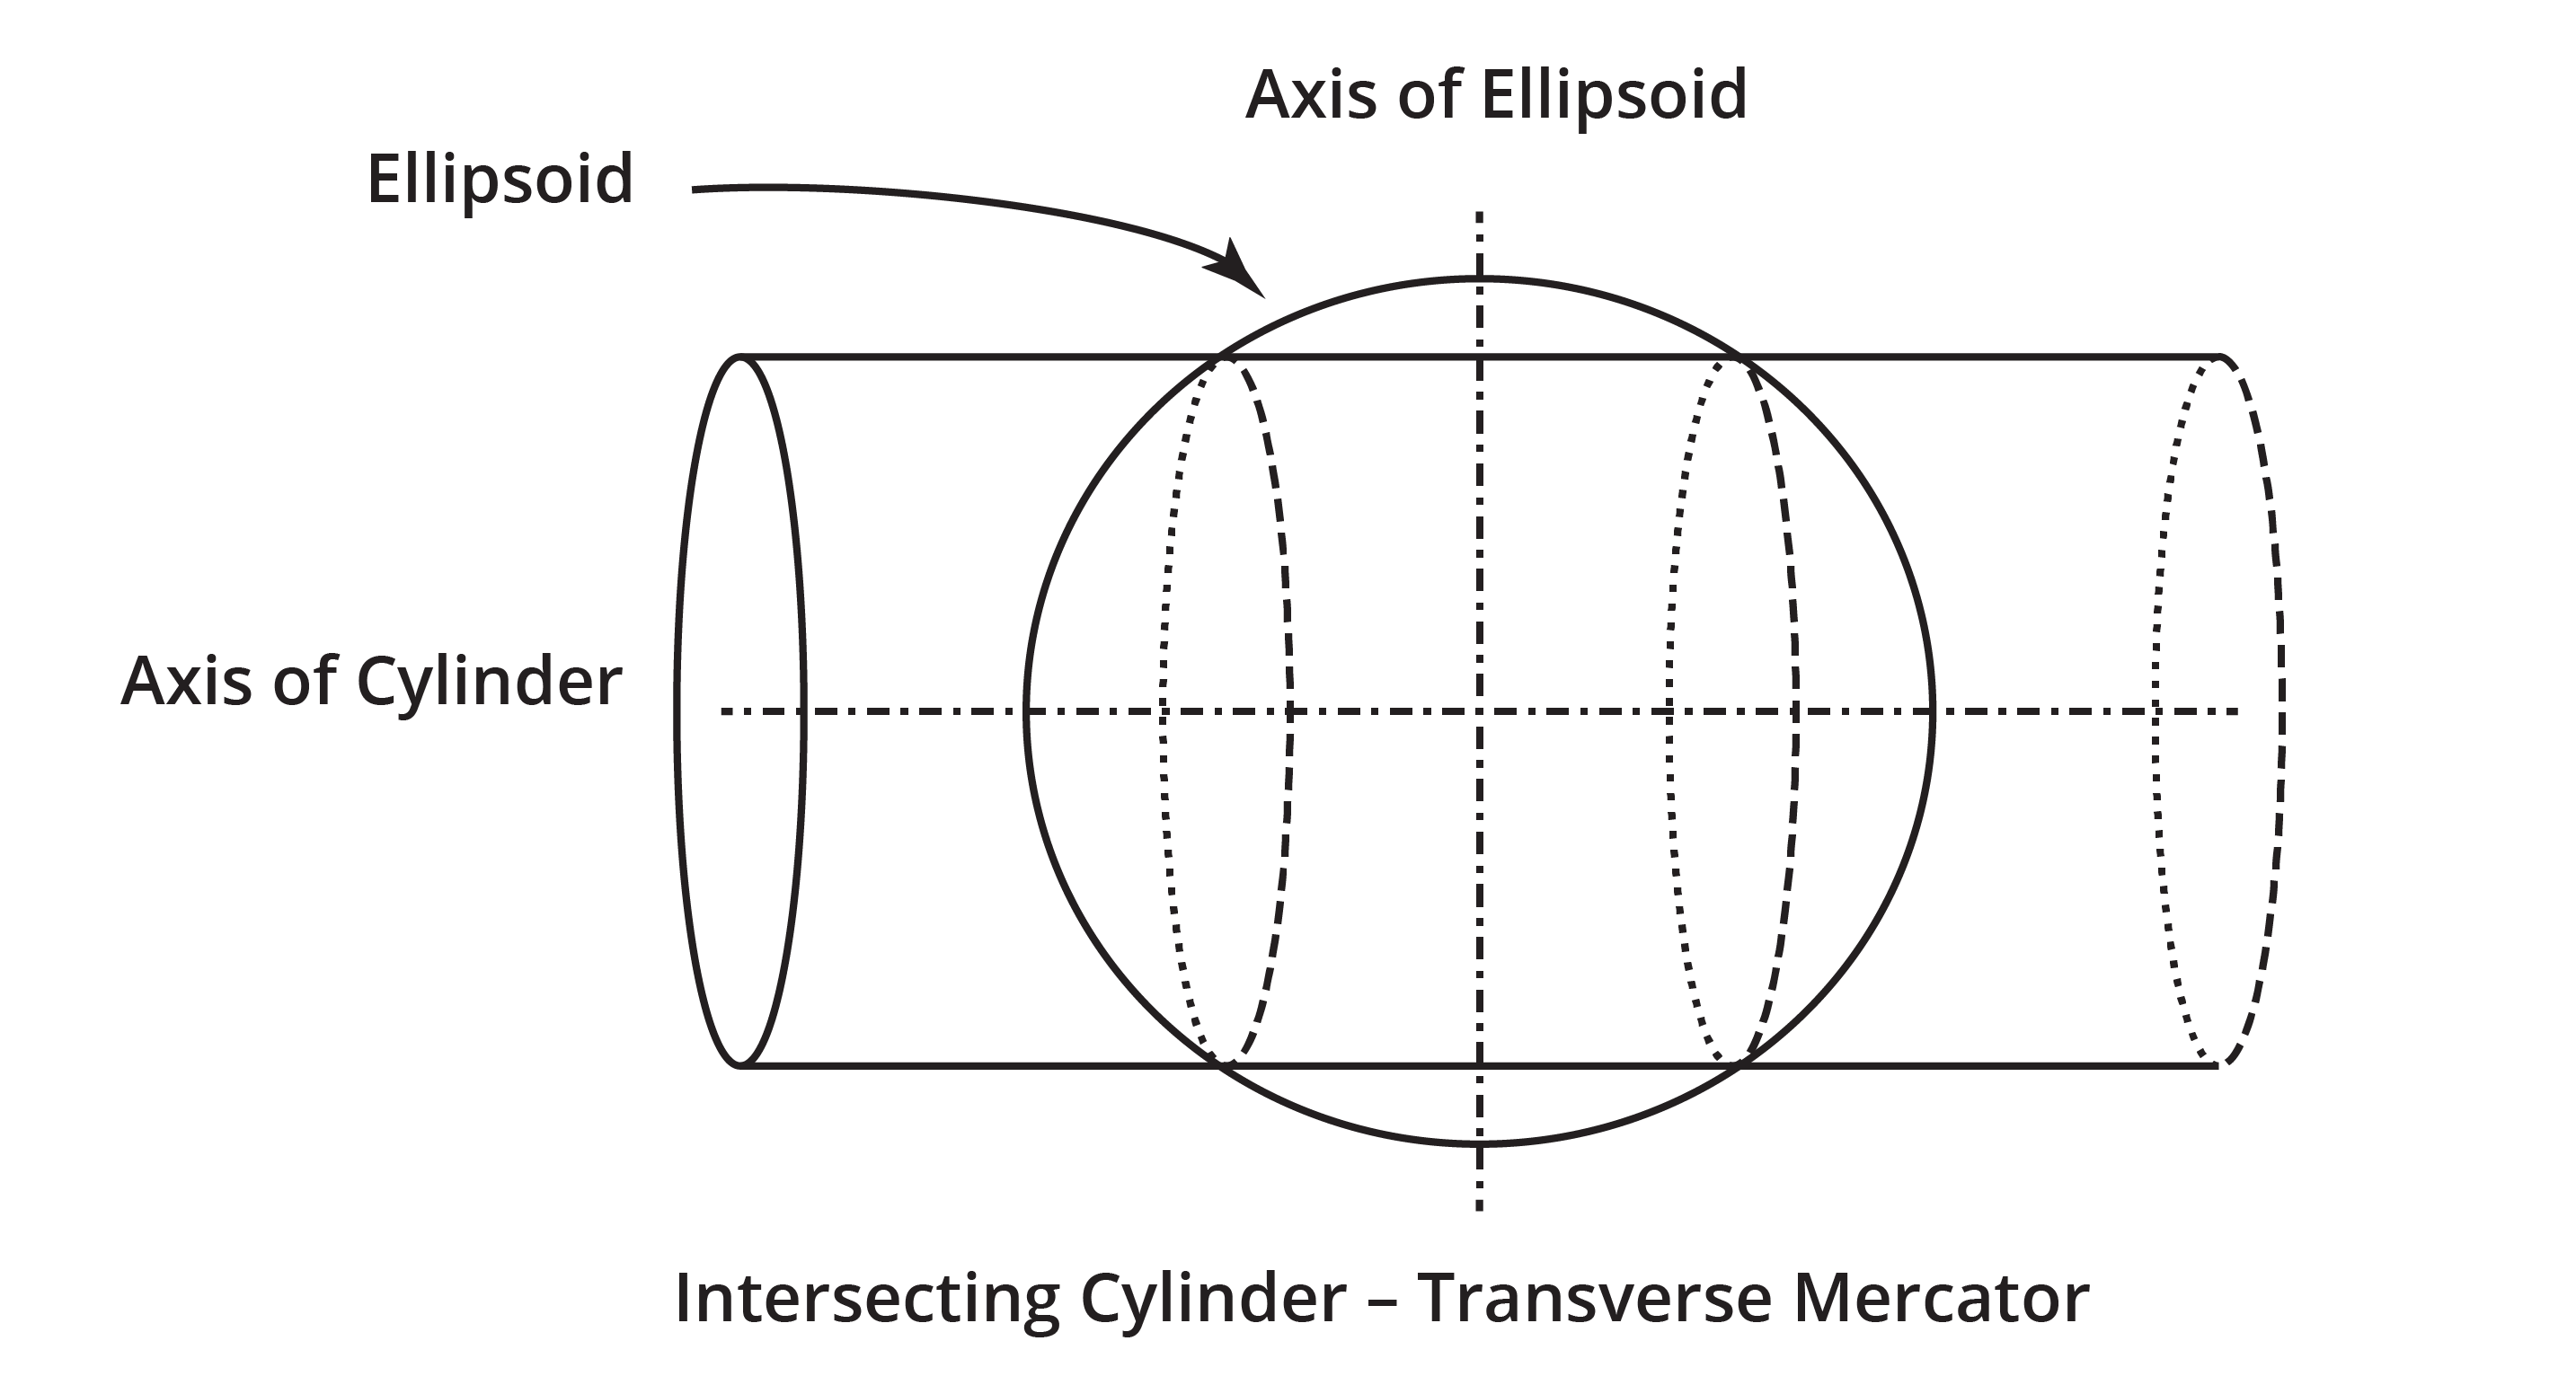
Cylindrical projections are like the one in the example above, however, sometimes the cylinder passes through the ellipsoid or sphere, as shown in Figure 2.5(a). This is probably the most common type of projection used, since being made famous by the Mercator projection.
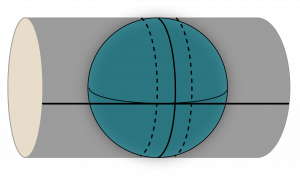
The Universal Transverse Mercator (UTM) projection, shown in Figure 2.5(b), a more modern version of the Mercator projection, is possibly the most common in use today. UTM works by dividing the world into a series of 60 consecutively numbered zones that are each 6 degrees of longitude wide, and the zones extend from 80 degrees North to 80 degrees South.
Conical projections
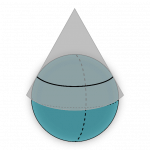
Conical projections are generally only used when you need to represent a region of one hemisphere of the Earth; they are not well suited for mapping large areas. Conical projections maintain the accuracy of an area but distort the shape of countries. The most common conical map projections are the Lambert or Albers projections, shown in Figure 2.5(c).
Plane projections
Plane projections remove the curving of the 2D surface that happens in the cylindrical and conical map projections, and simply keep the projection plane flat. See Figure 2.5(d).
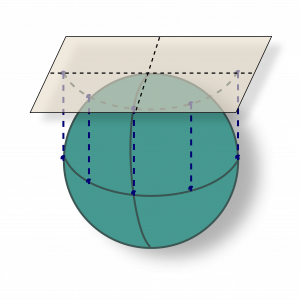
Imagine if we chopped the model of the Earth from earlier in half along the equator, and then placed it equator side down onto a glass table top that was lit from underneath. We then place a piece of paper on top of the North Pole, so that the paper is parallel to the table top. The pinpricks now have light coming through them that is perpendicular to the table top and also to the piece of paper – this is how a plane projection works.
In some sense the UTM is a combination of cylindrical and plane projections – the 60 zones mentioned earlier are essentially planes that have a central meridian of longitude. The central meridian is in the middle of the zone, which is 6 degrees of longitude wide, meaning the central meridian has 3 degrees of longitude either side of it. The central meridian is used as the true origin of the zone, but to avoid negative numbers, a false origin is used.
Map Grid of Australia
The map projection used in Australia is called the Map Grid of Australia (MGA) and is based on the cylindrical UTM projection. The units of MGA are in metres, making them easier to use in a practical sense.
Coordinates in MGA are described as eastings and northings, indicating the distance in metres from the origin in a positive eastwards direction (easting) and northward direction (northing).
The UTM zones that apply to Australia (west to east) are zone 46, at the Cocos (Keeling) Islands, through to zone 59 at Norfolk Island. Zones 50-56 cover the main continent of Australia, with zone 50 being the west coast and 56 the east coast of the mainland.
MGA coordinates are calculated relative to a GDA datum, so MGA2020 is the projection used for GDA2020, and MGA94 is used with GDA94. The origin of MGA2020 is a false origin, and has a value of (+500,000m, +10,000,000m).
Geoscience Australia has tools that incorporate mathematical formula, called Redfearn’s Formula, to determine grid coordinates (easting and northing) from geographic coordinates (latitude and longitude) and vice versa, for Australia.
New Zealand Transverse Mercator
The New Zealand Transverse Mercator 2000 (NZTM2000) map projection is based on the NZGD2000 datum, however, is only used for the main New Zealand island group – separate projections are defined for the offshore islands and the continental shelf.
