2 Design for Discovery
New and exciting scientific discoveries that have a positive impact on humanity are not usually stumbled upon by chance. Scientists systematically go about their work to create new knowledge in many important areas such as the treatment and prevention of disease.
We gain improved understandings of our natural world when scientists dedicate themselves to the pursuit of discovery by carefully preparing for, planning and conducting experiments. A scientist’s carefully controlled experiments produce data, and the data that build from many different – yet similar – experiments on a given topic provide evidence to help us understand more about a particular field or topic.
Effective experimental design is not haphazard; it is in itself a science, where a set of rules are followed to produce valid and reliable data.
In Chapter 1, we introduced the importance of scientific literacy, which includes the recommendation that student scientists understand science, including how we come by our scientific knowledge. We introduced the scientific method, of which a big component is experimentation. During your undergraduate degree, you will likely be given a chance to practise the scientific method and to design your own study.
This chapter will explain the principles of experimental design and lead you through some examples of experimental design in human physiology.
2.1 Researching human physiology
“Human research is research conducted with or about people, or their data or tissue.” –(National Health and Medical Research Council & Australian Research Council, 2007 p. 3).
Although there is no one perfect definition of research, it is generally agreed that research includes investigation carried out with the purpose of gaining knowledge and understanding, or for training researchers. The Australian Research Council states:
“Research is defined as the creation of new knowledge and/or the use of existing knowledge in a new and creative way so as to generate new concepts, methodologies, inventions and understandings. This could include synthesis and analysis of previous research to the extent that it is new and creative…” (Australian Research Council, 2022, para. 1).
“In research in human physiology, investigators may use human participants or animal subjects. Animals are commonly used to inform our understanding of how humans work. In contrast, animal physiologists study animals to inform their understanding of how animals function.” (Department of Education Skills and Employment, 2022).
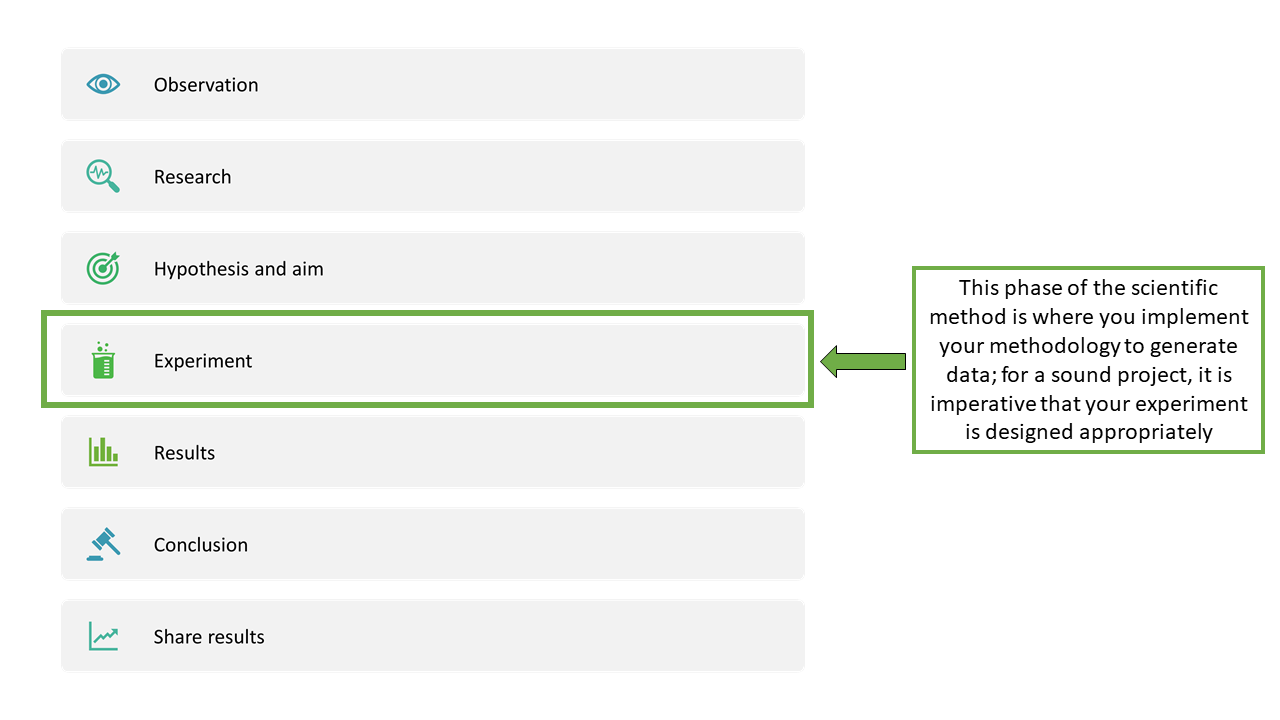
In this chapter, we will provide some practical tips on writing hypotheses, aims and conclusions, and then focus on the ‘experiment’ step of the scientific method (Figure 2.1).
Where to start?
Before designing an experiment, you will have read some research on the existing scientific literature on a topic and made an observation you cannot yet explain. This process will lead you to write the hypothesis for the study. More scientifically put, the hypothesis is a prediction of the effect of the independent variable on the dependent variable in a scientific research study.
A hypothesis is an assumption or prediction based on sound evidence – that is, an ‘educated guess’.
Scientists may differ on how they write their hypotheses; one simple model is presented here. Firstly, identify your independent variable and dependent variable; these are essential to the aim, hypothesis and conclusion of a study.
Independent variable
- The variable that the investigator intentionally changes in an experiment to observe its effect on other variables
- Example: in an experiment where a scientist studies the effect of artificial sweetener on body weight, artificial sweetener is the independent variable
Dependent variable
- The variable that changes in an experiment as a result of the independent variable
- Example: in an experiment where a scientist studies the effect of artificial sweetener on body weight, body weight is the dependent variable
Now that you have conducted research on the topic and decided on what you predict will happen under your experimental conditions, and you have established your independent and dependent variables, you can use the following schema to write your hypothesis.
Hypothesis
Simply replace the text in the boxes below with information specific to your experiment.
| Independent variable | will cause | dependent variable | to | predicted direction of change | experimental conditions |
For example:
| Artificial sweetener | will cause | body weight | to | increase | in healthy elderly humans |
Or:
| An acute dose of 100 mg of drug X | will cause | oxygen consumption | to | decrease | in healthy young adults |
Try to avoid hypothesising that your independent variable will have no effect on your dependent variable.
Here is a hypothesis written by a student with a suggestion for how it could be improved. The original hypothesis is missing some information that will make it clear and specific to the experiment that the student is planning to conduct.
Original hypothesis that needs some work:
| Listening to fast music | will increase | activity in the cardiovascular system (CVS) |
Revised hypothesis that is more precise and indicates what is being compared:
| Music with a high tempo (150 beats per minute [bpm]) | will cause | heart rate and mean arterial pressure | to | increase | more than music with a low tempo (75 bpm) |
Now that you have your hypothesis, it is simple to slightly modify this statement to write your aim.
Aim
The aim can be written using the same words as the hypothesis, with the addition of ‘to determine the effect of’ or ‘to determine if’ at the beginning of the sentence.
The aim of a scientific research study is to determine the effect of the independent variable(s) on the dependent variable(s).
Simply replace the boxes below with information specific to your experiment.
| To determine if | independent variable | will cause | dependent variable | to | predicted direction of change | experimental conditions |
For example, (this matches the hypothesis presented in the previous section):
| To determine if | artificial sweetener | will cause | body weight | to | increase | in healthy elderly humans |
Or, (this matches the hypothesis presented in the previous section):
| To determine if | an acute dose of 100 mg of drug X | will cause | oxygen consumption | to | decrease | in healthy young adults |
Here is an aim written by a student with a suggestion for how it could be improved. The original aim is missing some information that will make it clear and specific to the experiment that the student is planning to conduct.
Original aim that needs some work: Introduce participants to music with a range of BPMs in order to establish what effect if any the speed of music had on their CVS.
Revised aim that is more precise and indicates what is being compared:
| To determine if | music with a high tempo (150 bpm) | will cause | heart rate and mean arterial pressure | to | increase | more than music with a low tempo (75 bpm) |
We’re jumping ahead a bit, but it is a good place to discuss writing your conclusion. Your conclusion should be very tightly linked to your hypothesis and aim. In fact, you can base the wording of your conclusion on the wording of your hypothesis (and aim since it is written similarly to the hypothesis).
Conclusion
The conclusion can be written using the same words as the hypothesis. Just change the wording slightly to indicate how the results compared with your prediction.
A conclusion is the answer to your research question – a summary of how the results of a scientific study support or fail to support the hypothesis.
Simply replace the boxes below with information specific to your experiment.
| Independent variable | caused / or did not cause | dependent variable | to | observed direction of change | experimental conditions |
For example:
| Artificial sweetener | caused | body weight | to | increase | in healthy elderly individuals |
Or:
| An acute dose of 100 mg of drug X | did not cause | oxygen consumption | to | decrease | in healthy young adults |
Here are some conclusions written by students with suggestions for how they could be improved. The original conclusions are long-winded and wordy, and do not clearly link back to the hypothesis and aim.
Remember, if you collected usable data in your experiment, you can always state a conclusion! If you did not find a significant difference between groups or conditions, this is still a valid conclusion.
Original conclusion that needs some work: Despite the results indicating a slight increase in the cardiovascular system, statistical tests indicate that there was no statistically significant difference between the control and the music group. Therefore, due to the inconclusive results we cannot make any conclusions and further studies need to be completed.
Revised conclusion that is more concise and reflective of what the student investigated:
| Music with a high tempo (150 bpm) | did not cause | heart rate and mean arterial pressure | to | increase | more than music with a low tempo (75 bpm) |
Original conclusion that needs some work: Despite the results indicating a slight increase in time-to-exhaustion, statistical tests indicate that there was no statistically significant difference between the control and the caffeine group. Therefore, according to statistical tests, caffeine does not provide any additional benefits in improving time-to-exhaustion in cold conditions.
Revised conclusion that is more concise and reflective of what the student investigated:
| Caffeine | did not cause | running time to exhaustion | to | increase | in cold conditions |
Original conclusion that needs some work: An increased dosage of caffeine caused an increase in cognitive performance, however due to lack of statistical significant results, further research is warranted.
Revised conclusion that is more concise and reflective of what the student investigated:
| An acute dose of 150 mg of caffeine | did not cause | cognitive performance | to | improve | more than an acute dose of 50 mg of caffeine |
Original conclusion that needs some work: There were no statistically significant results, although a trend was observed with caffeine having a positive effect on cognitive performance.
Revised conclusion that is more concise although some more information could have been included to better reflect the experimental conditions:
| Caffeine | did not cause | cognitive performance | to | improve |
Now let’s design your experiment …
2.2 Designing an experiment to test your hypothesis
Now that you have your independent and dependent variables, an idea of your experimental conditions, and a hypothesis and aim, it’s time to design your experiment.
Control group experimental design
In a control group experimental design, the participants are divided into two groups, one of which is designated the control and the other the experimental group.
Before you begin your physiology experiment, you will need to create groups. If the purpose of your study is to investigate the differences or the influence of an independent variable on distinct populations – for example, males and females – this task will be simple. You would simply place the males into one group and the females into the other group.
If your study is not investigating distinct populations, and the purpose of your study is to investigate the effect of an intervention that may have permanent or long-lasting effects, or the experiments will be terminal for animal subjects (e.g. mice or rat study where animals are sacrificed to harvest organs and tissues for analysis) you will have to be a bit more thoughtful. In this situation, you will create two groups – a control and treatment.
A key feature of this type of experimental design is that the groups contain different individual animal subjects or human participants.
Control group
This group of animal subjects or human participants are treated identically to the treatment group, except they do not receive or experience the independent variable of interest. This typically involves the use of a placebo (e.g. sugar pill) or a sham of the independent variable where possible (e.g. sham exercise)
Treatment group
This group of animal subjects or human participants are exposed to the independent variable of interest – for example, an acute dose of caffeine or a 5-kilometre run.
A simple ‘before-and-after’ comparison on the same set of individuals is not valid, because it does not control for extraneous time-dependent variables (e.g., developmental age and learning).
In a control group experimental design, you would typically only have one control group. But, you could have one or more treatment groups, depending on the specifics of your study.
Creating control and treatment groups
Random assignment
If you have large sample sizes, or if the group of animal subjects or human participants are very similar, you can randomly assign the animals or humans to the control and treatment groups.
For example, when inbred strains of rat of a particular sex and age are being studied, the animals are so similar – genetically and physiologically – that random assignment to treatment groups is highly unlikely to produce groups with systematic differences. Systematic differences can introduce extraneous variables that interfere with the results of your experiment (see the next section).
Extraneous variables
An extraneous variable is an unwanted variable that is not the independent variable of interest, but influences the outcome of – and therefore adds error to – an experiment (Karanicolas et al., 2010). A major goal in research design is to decrease or control the influence of extraneous variables as much as possible. If you randomly allocate animal subjects or human participants that are very different to your control and treatment groups, you may find that these differences may influence the outcome of your experiment (see Box 2.1).
Box 2.1: Extraneous variables in control and treatment groups
You conduct an experiment on the effect of hormone Z on mice, and you randomly allocate your mice to control and treatment groups.
The control group is administered a placebo and the treatment group is administered hormone Z. The metabolic rates of all the animals are then measured, and groups compared, to determine whether the hormone has any effect on metabolic rate.
Imagine that random assignment had, by chance, resulted in two groups that differed substantially in average body mass or sex – although keep in mind that is more likely to occur in wild animals and not with specifically bred laboratory mice). This experiment would be unable to separate the effects of mass, sex and hormone treatment, all of which are known to affect metabolic rate.
In other words, in this example:
- mass and sex are the extraneous variables
- hormone treatment is the independent variable
- metabolic rate is the dependent variable
Introduction of such extraneous variables can be controlled by creating balanced groups – that is, experimental groups with no obvious differences.
Balanced groups
If you don’t have large sample sizes or your animal subjects or human participants are quite different, you should create balanced groups. Creating balanced groups will minimise or eliminate the effect of variables other than the ones you are investigating – that is, your independent variables.
Balanced groups are experimental groups with no obvious differences.
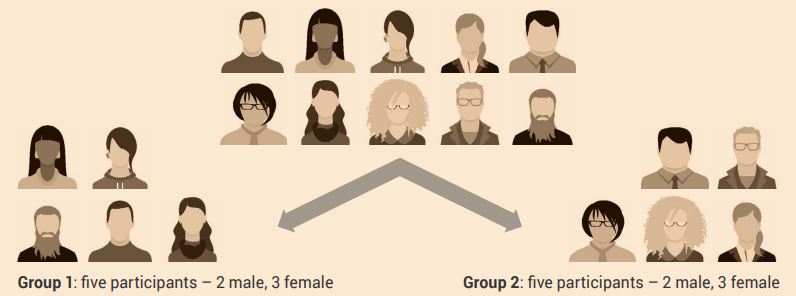
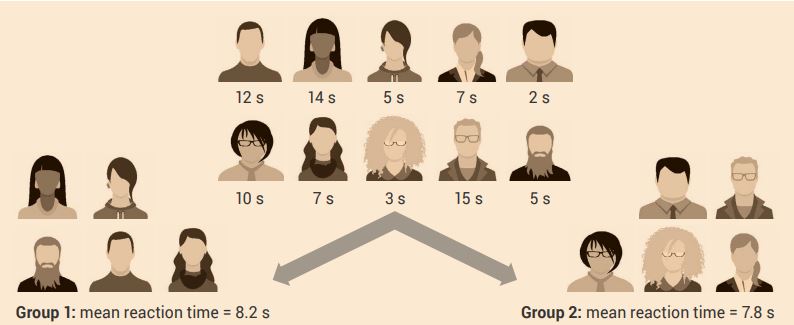
To create balanced groups, baseline measurements are taken and are then used to create groups with no obvious differences. This may be simple, such as equally assigning male and female subjects or participants to each group (Figure 2.2). You may use measurements such as the mean body mass index, grade point average, short-term memory span or minutes of weekly exercise to balance groups (Figure 2.3).
The variables that you use to balance groups should be the same as, or closely related to those, that you will measure in the experiments. If there are large amounts of variables to measure, the scientist must determine what are the most significant variables that are needed to be controlled for.
After balanced groups are created, the independent variable is then introduced.
Treatment order control / cross-over experimental design
In a treatment order / cross-over experimental design, each participant is measured under the control and experimental treatment conditions, with one-half of the participants experiencing the conditions in reverse order.
You should use a treatment order control experiment design, also known as the cross-over experiment design for some types of experiments. For example, if you are investigating the effects of a treatment that only causes short-term effects, and you are not studying the difference between distinct populations or using animal subjects where the experiment will be terminal for them.
In this experimental design you will decide on your conditions – for example, the effects of an acute bout of aerobic exercise on short-term memory. Instead of having two separate groups, one as a control (no exercise) and the other as a treatment group (exercise) as you would for the control group experimental design, each participant is measured under the control and treatment conditions, with one-half of the participants experiencing the conditions in the reverse order.
This type of design can also have more than one treatment condition. In this case, animal subjects or human participants will experience all conditions, but in a different order.
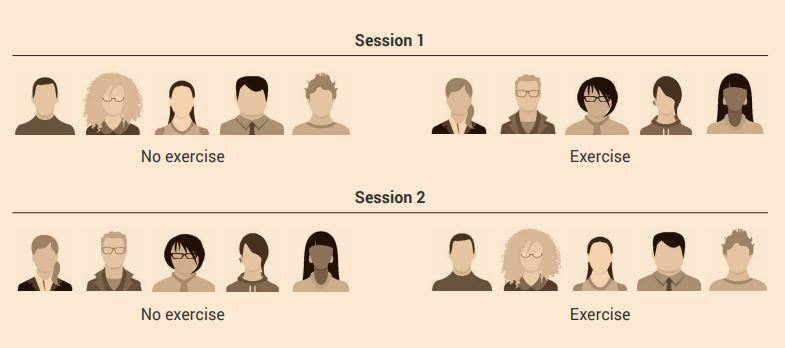
The analysis for a cross-over design considers only the differences between the two (or more) measurements (dependent variables) from each individual. This makes it a powerful design, because it eliminates the ‘noise’ resulting from differences between individuals. Put more simply, each animal subject or human participant acts as their own control (Figure 2.4).
Experimental noise is the …inherent variation existing between different subjects for a variable measured under control or treatment conditions.
It is important to note that physiological experiments that use animal subjects generally use the control group experimental design, and not the cross-over design. In animal studies, it is very common that the experiments are terminal.
Placebos
A placebo is used in research studies that investigate the effects of medicines. The treatment group receives the medicine, and the control group receives a placebo – a dummy medicine that has no therapeutic effect. An example of a dummy medicine is a sugar pill that looks identical to the real medicine. Comparing the results from both groups should indicate the effectiveness and side-effects of the drug.
Placebos can be used in both control group experimental designs and cross-over designs. However, keep in mind that the cross-over experimental design would not be appropriate if:
- the drug was to be taken over a long period of time – say, years
- it could cure a disease or condition
- it had long-lasting effects.
Interestingly, in studies that used placebos, human participants don’t know if they are receiving the dummy medication or the real thing, and sometimes not even the researchers know. We will expand on this concept of blinding a bit later.
Logic should tell you that the placebo will have no effect. However, a strange phenomenon called the ‘placebo effect’ can occur, which is when people get better when they are taking the placebo. There are various hypotheses that attempt to explain this phenomenon, but the underlying mechanisms remain mysterious.
Another interesting piece of information that you may initially find odd is that placebos are also administered in animal studies.
Why would scientists do this? What’s the point if the animals are not going to be psychologically concerned with the treatment – that is, why bother if there is no placebo effect?
Well, imagine a control group experimental design study where treatment rats are injected with a drug every day for a month. Remember that the only difference between control and treatment groups should be the independent variable – in this case, the drug.
Keep in mind that, in addition to the independent variable (the drug), the treatment animals will also receive an injection every day.
Can you determine what the placebo would be for this experiment?
If you said the control group would also receive a daily injection, but with just the drug vehicle (the substance that the drug is dissolved or suspended in, without the drug), you’d be right.
If the placebo isn’t administered, the drug would not be the only variable that the treatment animals receive compared with the control animals. The extraneous variables introduced into the study are the injection itself and the drug vehicle, which may affect the results. For example, the injections could cause the animals stress each day, in which case the study would be investigating the effects of the drug and stress. However, if the control group received a daily injection as well, the investigators could conclude that any differences seen between the two groups were a result of the drug only.
Blinding
How much will the participants and investigators know about the details of the experiment?
Blinding refers to hiding certain information (e.g., group allocation) from one or more individuals involved in a research study.
Blinding attempts to minimise or eliminate bias that may result if the participants or investigators know too much about the experimental conditions. As result, those involved in the research may unconsciously change their behaviour. Investigators may observe participants differently if they know they received the experimental drug rather than the placebo – this may bias the results. Participants may respond differently if they know they received the drug and not the placebo based on their pre-conceived ideas about what should happen.
Bias is a process where the scientists performing the research or the participants of the research influence the results, in order to portray a certain outcome.
Blinding is used in both control group and cross-over experimental designs. The best strategy is to blind as many individuals as possible in a research study. You may choose to have a single-blind or double-blind study.
Single-blind study

In a single-blind experiment, the individual participants do not know which group they are in (control or treatment) and what intervention they will receive.
For example, in a study investigating the effects of caffeine ingestion on endurance running performance, participants don’t know if they are taking caffeine or a placebo.
Double-blind study

In a double-blind experiment, the individual participants and the persons administering the experiment are unaware of critical aspects of the experiment, with this information being held by a third party, and is only revealed to the investigators when the study is over. A double-blind procedure is used to protect against both placebo effects and investigator bias.
For example, in a study investigating the effects of caffeine ingestion on endurance running performance, the participants and the investigators don’t know who is taking placebo and who is taking caffeine at the time of ingestion.
Animal subjects and human participants
When physiologists experiment to learn more about humans, it may surprise you to hear that we often use animal subjects as well as human participants. Of the laboratory animals that we use for research, 95% are mice and rats. Laboratory mice and rats make an ideal model to study human physiology because:
- their genetic, biological and behavioural characteristics closely resemble those of humans
- many human disease states can be replicated in these animals
- they are inexpensive, and easy to handle and house
- they have a short-life span
- they are almost genetically identical – apart from sex differences – because they are usually inbred.
Genetic similarity greatly reduces the risk of introducing extraneous variables into the study and is the reason why random assignment is an appropriate method for creating groups. Group size would typically be around 10 animals, although this may differ depending on techniques used. It is standard practice to use the same strain sex and age of animal in any given study.
Animal studies usually have a control group experimental design, because these types of experiments are often terminal for the animals.
Human studies are not as straightforward and may vary widely – experiments may have 5–10 participants per group, and up to 1000s when longitudinal analyses or meta-analyses are carried out. Reading the current literature on your topic will give you an indication of how many study participants are commonly required in your area of research.
There is likely to be much greater genetic variation among study participants, as well as differences in lifestyle factors (e.g. different diets and levels of exercise, and some people smoke). Because of these differences in humans, it becomes crucial when using control group experimental designs to balance groups, to try and limit the number of extraneous variables introduced to the study.
The size of the expected effect of the phenomena you are investigating is important. If you are investigating something that is likely to have a small effect, you will need more subjects or participants than if you are studying something that is likely to have a large effect. An investigator will conduct a power analysis when designing their study. A power analysis is a statistical approach used to determine the minimum number of subjects or participants required so you can reasonably expect to detect an effect of a given size.
2.3 Examples of experimental design in human physiology
The following sections are examples of human participant studies using different experimental designs. To determine if there are significant differences between your two groups after collecting the data (datasets), you will need to perform a statistical analysis. The experimental design that you choose will determine which statistical test you should use.
Chapter 3 tells you how to do these statistical analyses.
Control group experimental design
Two experimental groups
Example of a study of animal subjects using control group experimental design
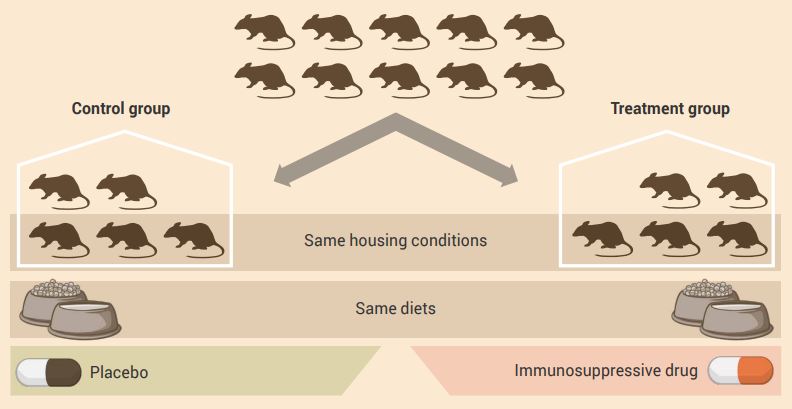
An example of a control group experimental design is shown in Figure 2.7.
Aim: To determine the effect of an immunosuppressive drug (independent variable) on blood vessel function (dependent variable).
Experiment: A group of animals is randomly assigned to either a control or treatment group, with each group containing equal numbers. All animals are housed under the same conditions, but the treatment group animals receive the drug and the control group receives a placebo.
Example of a study of human participants using control group experimental design
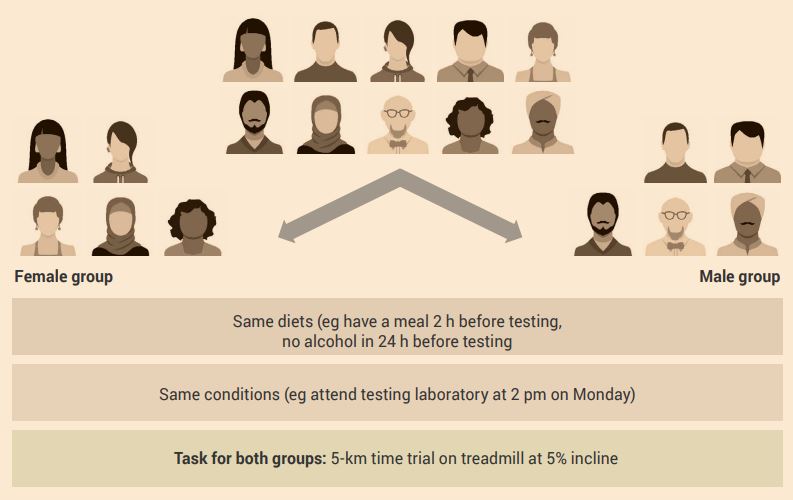
An example of a control group experimental design for human participants is shown in Figure 2.8.
Aim: To investigate and determine the effect of gender on exercise performance.
Experiment: Human participants are assigned to either a male or female group. All participants experience the same conditions – the difference is their gender (independent variable).
For Figure 2.7 and Figure 2.8 use an independent t-test to compare the measurements (dependent variables) from the two groups (conditions). By doing this, you will determine the effect of the independent variable on the dependent variable(s).
More than two experimental groups
Example of a study of animal subjects using control group experimental design
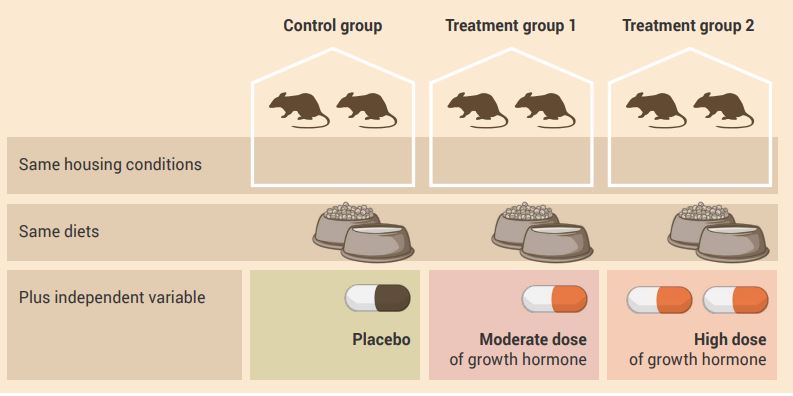
An example of a control group experimental design with more than two experimental groups is shown in Figure 2.9.
Aim: To determine the effect of chronic administration of two doses (moderate and high) of growth hormone (independent variable) on muscle size (dependent variable).
Experiment:
- The control group receives daily administration of a placebo.
- Treatment group 1 receives daily administration of the moderate dose of growth hormone.
- Treatment group 2 receives daily administration of the high dose of growth hormone.
Example of a study of human participants using control group experimental design
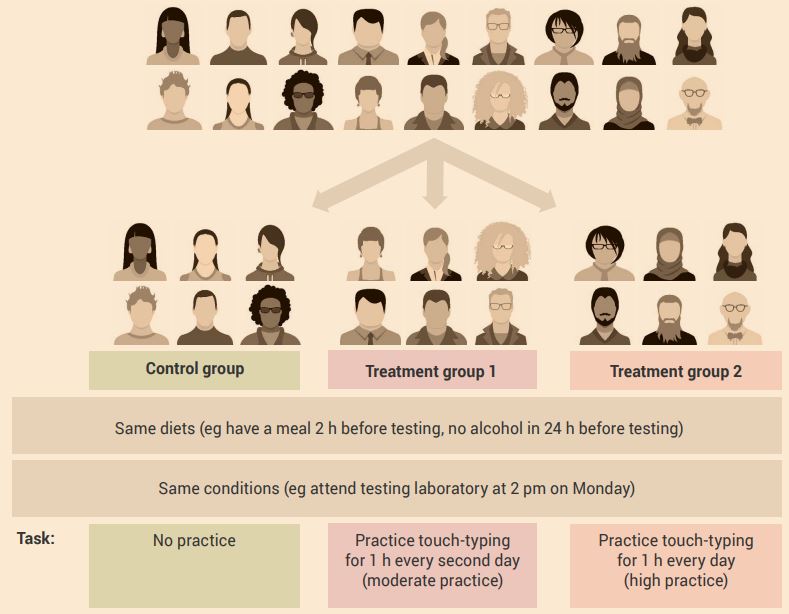
An example of a control group experimental design with more than two experimental groups is shown in Figure 2.10.
Aim: To determine the effect of different amounts of touch-typing practice (independent variable) on touch-typing skill development (dependent variable).
Experiment: In this case, a cross-over design would be inappropriate. Because of the learning effect of the treatment, an extraneous variable is introduced.
For Figure 2.9 and Figure 2.10 use a one-factor analysis of variance (ANOVA) independent samples test to compare the measurements (dependent variables) made in the three or more groups. By doing this, you will determine the effect of the independent variable on the dependent variable.
If the ANOVA reveals statistical significance between the groups, conduct a post hoc test to determine where the statistically significant differences exist (e.g. in Figures 2.9 and Figure 2.10, there could be significant differences in the dependent variable between the control and treatment group 1, the control and treatment group 2, and/or treatment groups 1 and 2).
Treatment order control / cross-over experimental design
Two experimental groups
Example of a study of human participants using treatment order control / cross-over experimental design
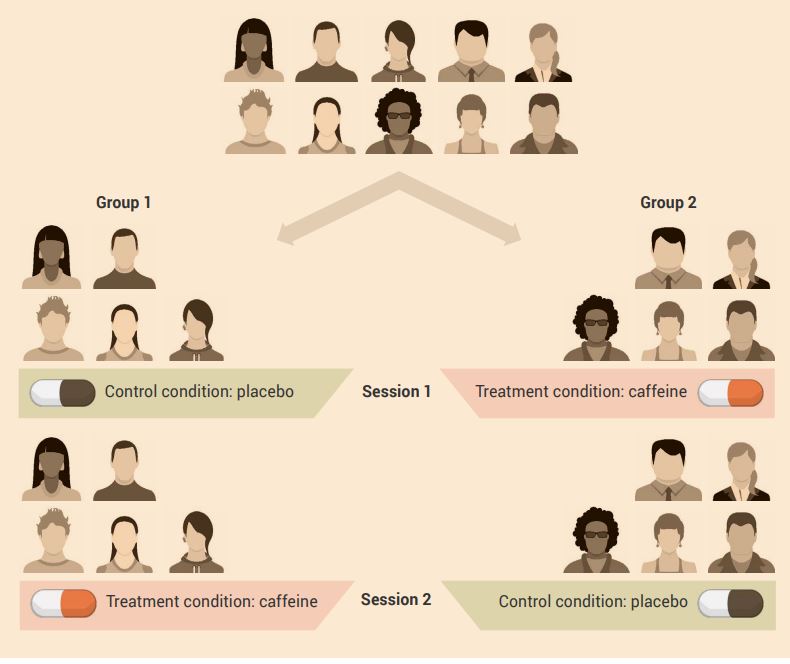
An example of a cross-over experimental design is shown in Figure 2.11.
Aim: To determine the effect of caffeine on cognitive performance.
Experiment: A group of participants have their cognitive performance measured after consuming either caffeine or placebo on two test days, separated by at least seven days.
In week 1:
- group 1 participants consume the placebo
- group 2 participants consume caffeine before cognitive testing.
In week 2, the reverse happens:
- group 1 consumes caffeine before cognitive testing
- group 2 consumes placebo before cognitive testing.
Caffeine is usually eliminated from the body in under two days, so there would not be a carry-over effect of caffeine in group 2 participants one week after initial testing when the second session of testing occurs.
Use a paired t-test to compare the measurements obtained in the two conditions.
To determine the effect of the independent variable, combine the data (dependent variable) from groups 1 and 2, and conduct a paired t-test.
More than two experimental groups
Example of a study of human participants using treatment order control / cross-over experimental design
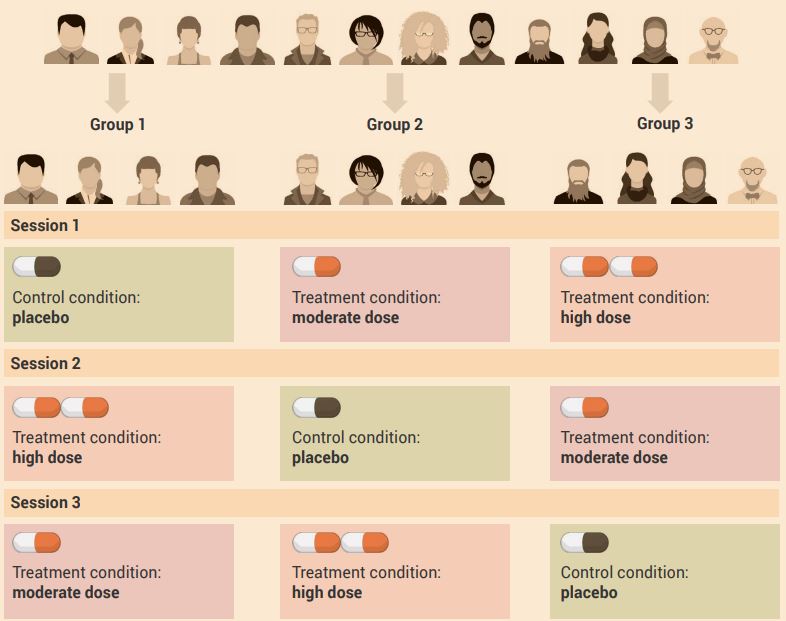
An example of a treatment order control / cross-over experimental design with more than two experimental conditions is shown in Figure 2.12.
Aim: To determine the effect of moderate and high doses of caffeine (independent variable) on the time it takes to complete a 5 km running trial (dependent variable).
Experiment: In this example, participants have their running performance measured after consuming either moderate- or high-dose caffeine, or placebo, on three test days, with testing separated by at least seven days.
In week 1:
- group 1 participants consume the placebo before the 5-km run
- group 2 participants consume moderate-dose caffeine before the 5-km run
- group 3 participants consume high-dose caffeine before the 5-km run.
In week 2:
- group 1 consumes high-dose caffeine before the 5-km run
- group 2 consumes placebo before the 5-km run
- group 3 consumes moderate-dose caffeine before the 5-km run.
In week 3:
- group 1 consumes moderate-dose caffeine before the 5-km run
- group 2 consumes high-dose caffeine before the 5-km run
- group 3 consumes placebo before the 5-km run.
Caffeine is eliminated from the body in less than two days, so there would not be a carry-over effect one week after testing.
Use a one-factor analysis of variance (ANOVA) correlated samples test to compare the measurements (dependent variables) when there are at least three conditions. To determine the effect of the independent variable, combine the data (dependent variable) from all groups for each condition.
If the ANOVA reveals statistical significance between the groups, conduct a post hoc test to determine where the statistically significant differences exist (e.g. in Figure 2.12, there could be significant differences in the dependent variable between the control and experimental level 1, the control and experimental level 2, and/or experimental levels 1 and 2).
Investigating the effect of multiple independent variables
You may wish to conduct a more complex experiment in which you are testing the effect of multiple independent variables, such as time (pre-test and post-test) and drug (placebo and drug).
Example of a study of human participants using control group experimental design where more than two independent variables are introduced
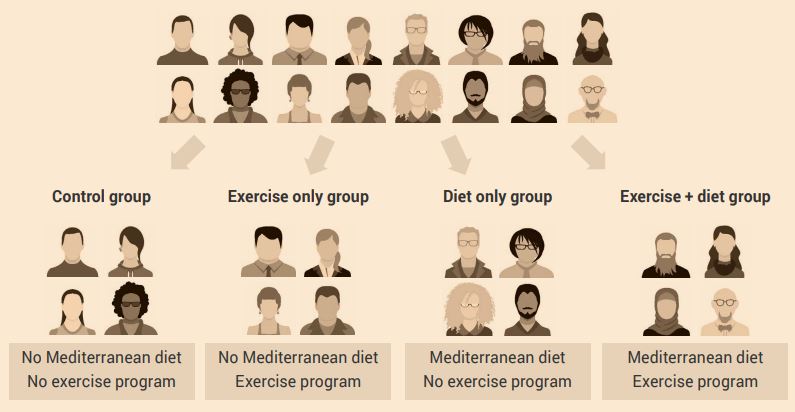
An example of this experimental design is shown in Figure 2.13 where the aim of the study is to investigate the effect of an exercise program alone and the exercise program plus adoption of the Mediterranean diet on a group of patients who have suffered an adverse cardiovascular event. The two independent variables are the exercise program and the diet.
Long-term and ongoing adoption of the diet rules out the possibility of using a cross-over design.
Use a two-factor analysis of variance (ANOVA) independent measures test to compare the measurements (dependent variables) made in the three or more conditions. By doing this, you will determine the effects of the independent variables on the dependent variable.
When this study design is used, it is possible to find main effects and interaction effects. Main effects are significant differences in dependent variables caused by the independent variables. In this example, this means effects of diet and/or exercise on their own. Interaction effects are significant effects that result when independent variables are combined – in this example this means effects of diet and exercise together.
When the ANOVA finds significant main effects of one or more factors (independent variables), conduct a post hoc analysis to determine which differences are significant.
Example of a study of human participants using treatment order control / cross-over experimental design where more than two independent variables are introduced
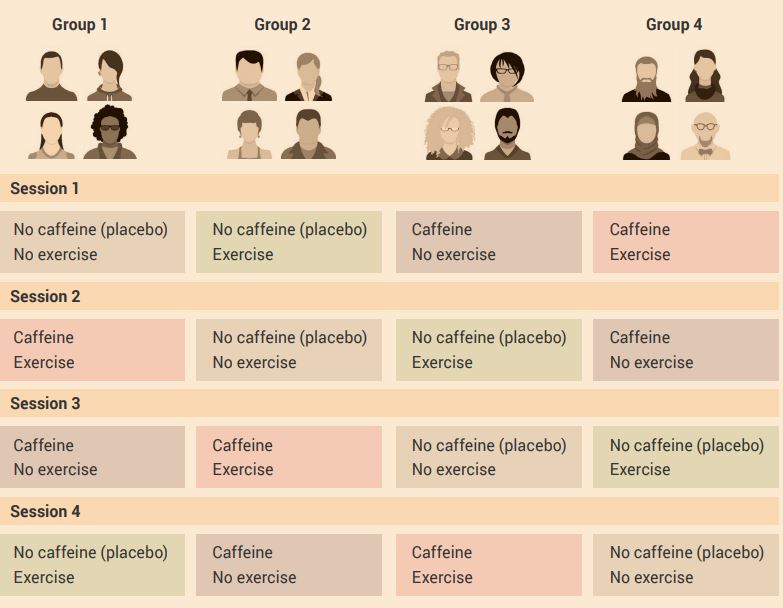
An example of this experimental design is shown in Figure 2.14.
Aim: To determine the effect of an acute bout of exercise alone, and exercise plus an acute dose of caffeine, improves short-term memory function in humans.
Experiment: The two independent variables are exercise and caffeine. The short-term effect of caffeine allows us to use a cross-over design. The participants and investigators can be blinded to caffeine, but not for exercise.
Use a two-factor analysis of variance (ANOVA) repeated measures test to compare the measurements (dependent variables) when there are at least two independent variables. To determine the effects of the independent variables, combine all data (dependent variable) from all groups for each condition.
When this study design is used, it is possible to find main effects and interaction effects. Main effects are significant differences in dependent variables caused by the independent variables. In this example, this means the effects of caffeine and/or exercise on their own. Interaction effects are significant effects that result when independent variables are combined – in this example, this means the effects of caffeine and exercise together.
When the ANOVA finds significant main effects of one or more factors (independent variables), conduct a post hoc analysis to determine which differences are significant.
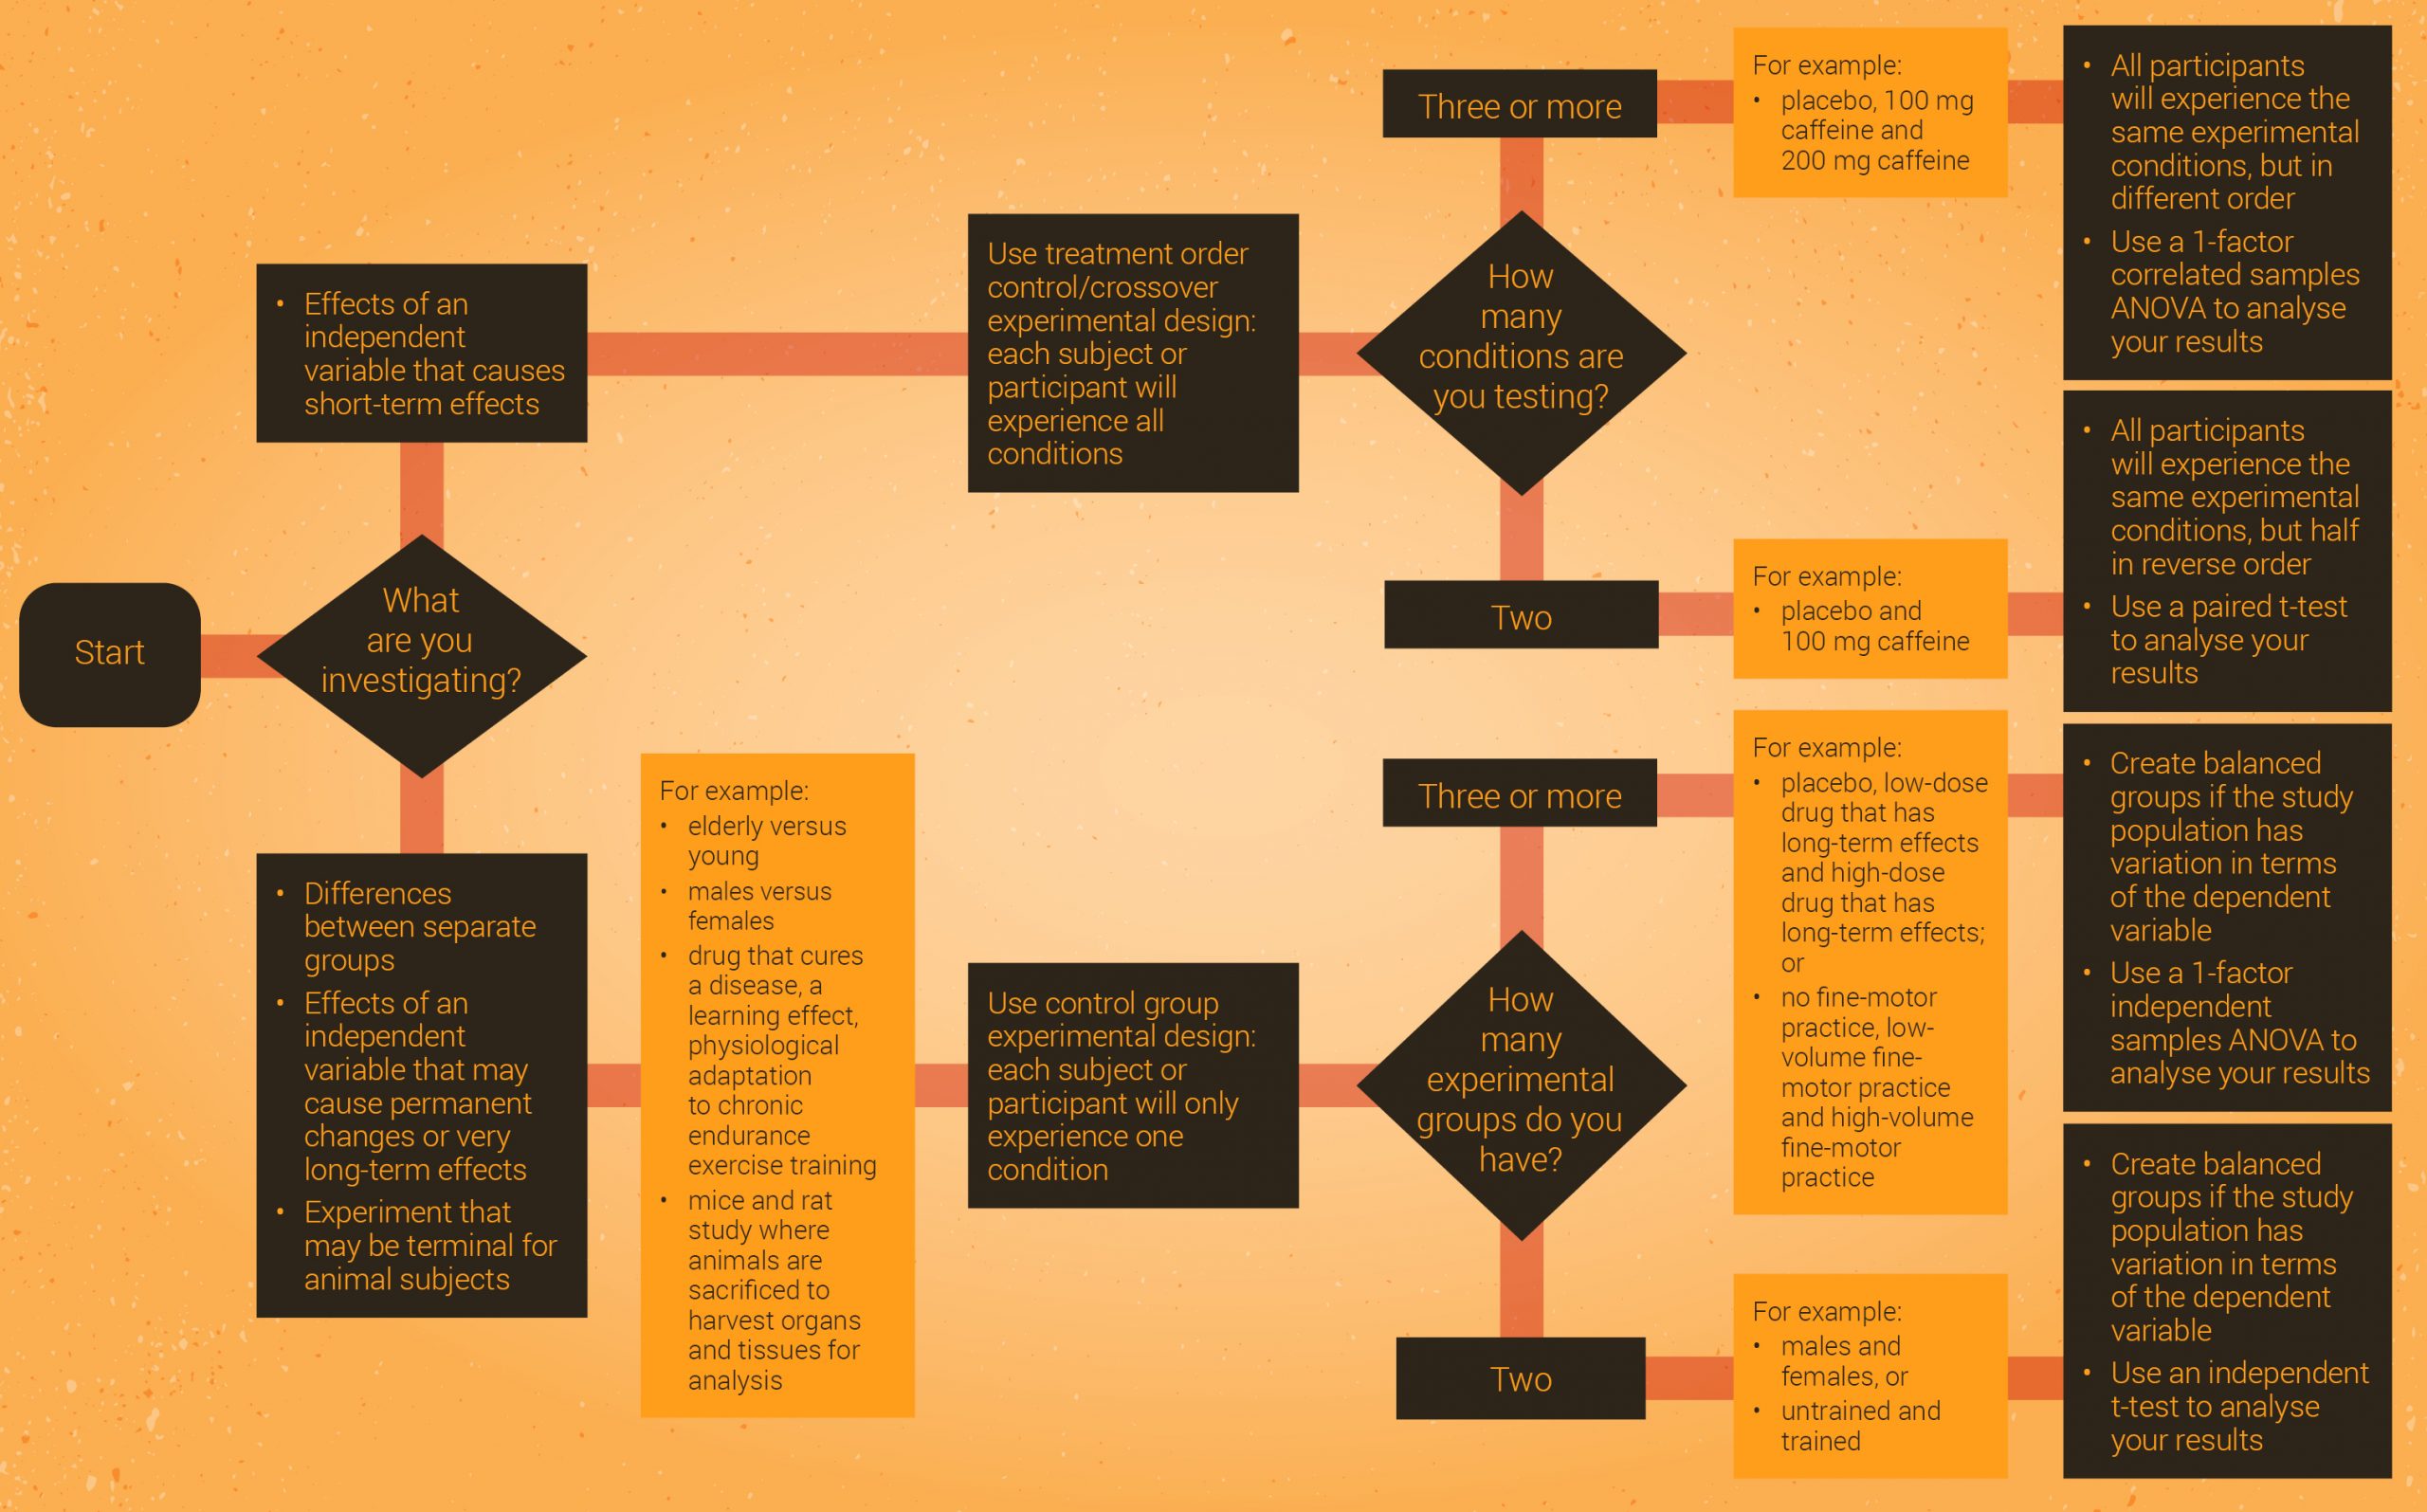
All of this can be a bit overwhelming, so Figure 2.15 is a flowchart that summarises how to decide which experimental design and statistical analysis to use. A clearer version of this flowchart [PDF] is available to download.
Click the drop down below to review the terms learned from this chapter.
Copyright note:
- The quotation from the National Health and Medical Research Council is used under a CC-BY 4.0 licence.
- The quotation from the Australian Research Council is reproduced with permission.
- The quotation from the Department of Education, Skills & Employment (DESE) is used under a CC-BY 4.0 licence.
References
Australian Research Council. (2022). Definition of Research. Retrieved May 25, 2022 from https://www.arc.gov.au/sites/default/files/minisite/static/4551/ERA2015/intro-3_define-research.html
Department of Education Skills and Employment. (2022). Research block grants: Higher education research data collection (HERDC). Retrieved from https://www.dese.gov.au/research-block-grants/higher-education-research-data-collection-herdc
Karanicolas, P.J., Farrokhyar, F., & Bhandari, M. (2010). Blinding: Who, what, when, why, how? Canadian Journal of Surgery, 53(5), 345-348.
National Health and Medical Research Council, & Australian Research Council. (2007). National Statement on Ethical Conduct in Human Research 2007. https://www.nhmrc.gov.au/about-us/publications/national-statement-ethical-conduct-human-research#toc__16
