6 Communicating Scientific Discoveries to Peers
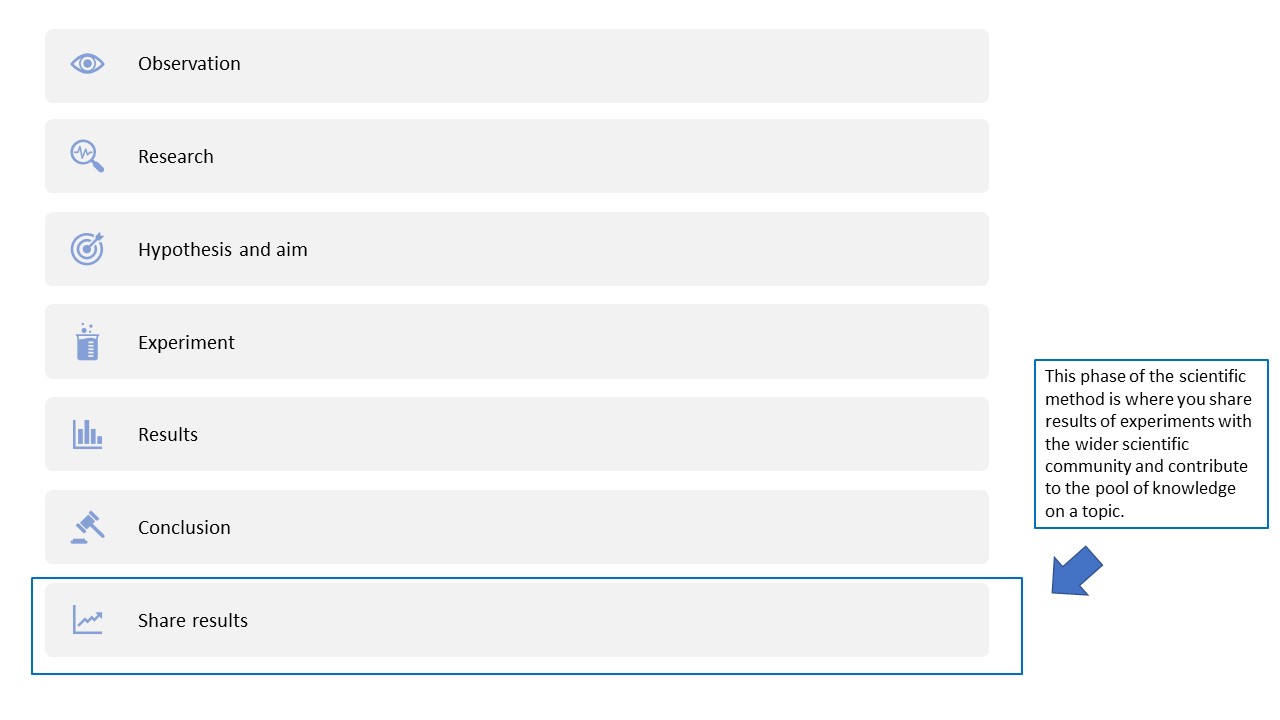
Science only moves forward when the findings of research investigations are communicated widely. After carrying out the experiment (an original investigation) and using the results to inform a conclusion as to the appropriateness of your hypothesis (Chapter 2), you are ready to share your findings (Figure 6.1).
Initially, research outcomes are communicated within the scientific community by scientists themselves. Results are then presented outside of the scientific community, by scientists or other professionals, such as science journalists and teachers.
Typically, scientists communicate their work within the scientific community by writing and publishing research articles and presenting posters and oral communications at scientific conferences. It is through these modes of communication that scientists have their work put through the gruelling test of peer review, where the work is both criticised and commended by other expert scientists. Only work that is recommended by peers will find its way to an issue of a peer-reviewed journal.
Peer-reviewed refers to the process by which scholarly work is checked by a group of experts in the same field to make sure it meets the journal standards before it is accepted or published.
The peer-review process for oral communications and poster presentations at scientific conferences is a little less gruelling than for journals, although, a peer-review process is still applied before the work is accepted by conference organisers. Although many scientists will grimace at the mention of ‘peer-review’, it is through this process that we increase the likelihood that valid science (and not pseudoscience) is shared with the world. Peer review is an essential part of the scientific process, to make important economic and health-related decisions that affect the future prosperity of humanity.
As with all forms of communication, scientific research articles, oral communications and poster presentations need to be prepared and delivered according to specific guidelines and using particular language. It is important that student scientists begin to understand these guidelines and are given opportunities to practise these forms of communication. This chapter provides a roadmap for preparing and delivering these important modes of scientific communication.
6.1 Research articles
A research article reports the results of original research, assesses its contribution to the body of knowledge in a given area, and is published in a peer-reviewed scholarly journal.

Research articles generally step the reader through the stages of the study. An example of a research article presenting the results of an original investigation is shown in below.
There are now 1000s of peer-reviewed journals in which scientists can publish the outcomes of their research. Each journal will have a slightly different format for their papers, but generally will include an abstract, introduction, methods, results, discussion and conclusion, and references section. In addition, some journals are requiring plain English summaries.
We will look at each section in turn and provide some tips for writing each section for your research.
When looking at each section of a journal article, we will highlight how the authors have presented certain information processes. We will explain how to write the sections of an article by referring to a research article of an original investigation that was published in Physiological Reports and shown in Figure 6.2. Each section from the published paper is annotated to highlight important features of the format of the research article.
Summary for non-experts
In recent years, it has become more common for journals to request authors to also provide a short summary of their research paper that is understandable by non-experts, such as members of the public, high school and university students, scientists from other disciplines, and members of the health care community. For example, The Journal of Physiology publishes a ‘Key-points summary’ at the beginning of each research article. According to the journal’s editors, this summary was introduced with the following intentions:
- It can help readers to decide quickly if the paper is relevant or interesting.
- It helps scientists from disciplines related to physiology learn about the work by providing an easy-to-read summary of the research.
- It allows audiences other than scientists to engage with current research in physiology, including students, patients or carers, and the media.
The summaries are written clearly in plain English, without scientific jargon, abbreviations or acronyms. Sentences are kept as short as possible.
The specific format for a summary for the non-expert audience will vary from journal to journal but will have the same principles. We’ll use the Key-points summary in The Journal of Physiology as an example to look at this type of writing in more detail.
The Journal of Physiology gives authors guidelines for preparing their Key-points summary (The Physiological Society, 2016); these are summarised below along with an example that has been annotated to highlight important features.
General guidelines for writing a Key-points summary:
- The summary should be written in no more than 150 words and no more than five bullet points
- One or two points on background to the present study
- One or two points on what the paper adds to existing knowledge
- One or two points on the importance of the results to body function in health and/or disease.
- Language used should be understood by non-specialists with general scientific knowledge.
- The summary should accurately reflect the findings of the paper and implications for future research.
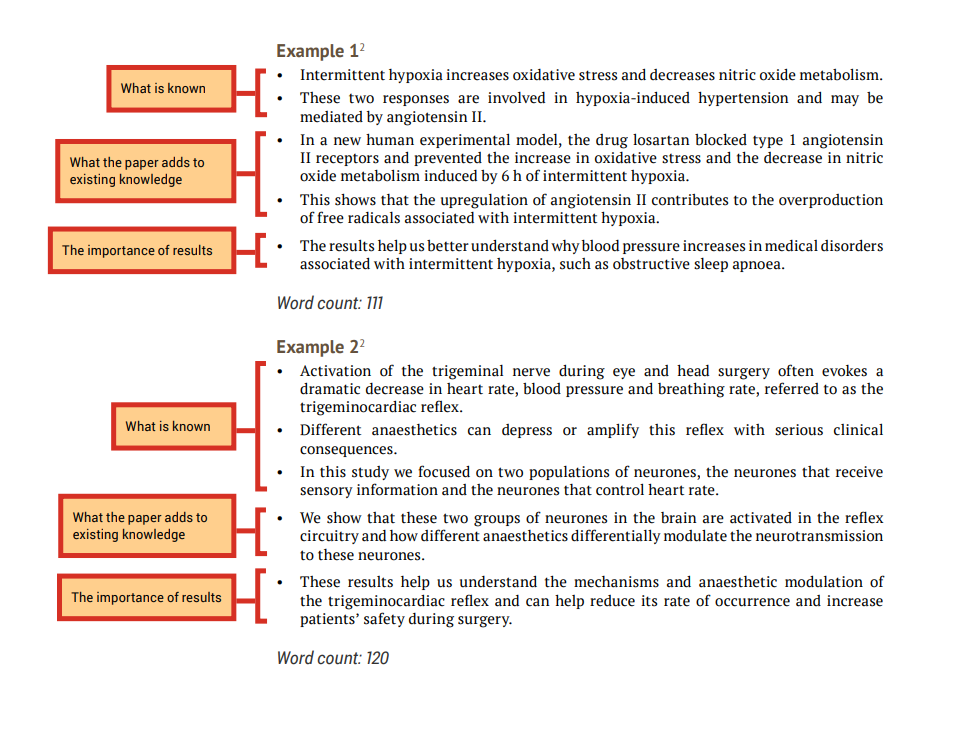
Examples of Key-points summaries from The Journal of Physiology Instructions to Authors (The Physiological Society, 2016) have been highlighted to show how to write summaries that adhere to the guidelines and state:
- what is known
- what the paper adds to existing knowledge
- the importance of results
Abstract
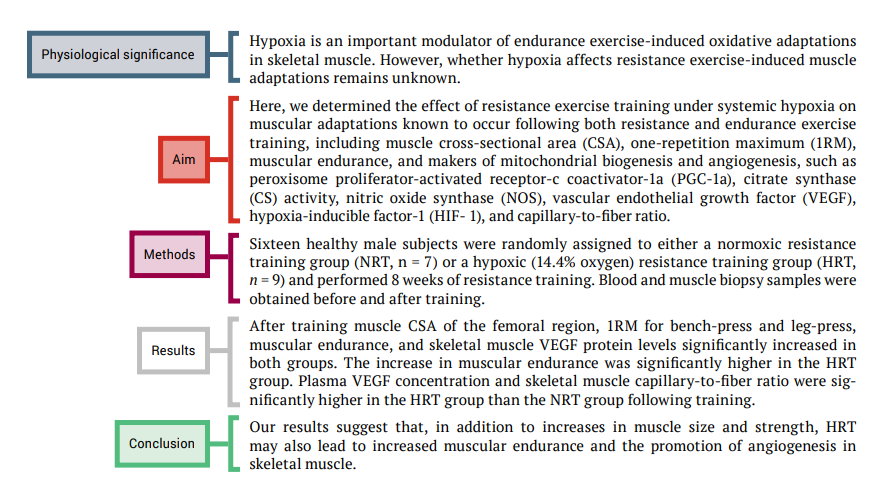
An abstract is generally a single paragraph that accurately reflects the contents of the paper – that is, the introduction, methods, results, and conclusion.
Please note: the examples below are adapted from Kon, M, Ohiwa, N, Honda, A, Matsubayashi, T, Ikeda, T, Akimoto, T, Suzuki, Y, Hirano, Y & Russell, A 2014, ‘Effects of systemic hypoxia on human muscular adaptations to resistance exercise training’, Physiological Reports, vol. 2, p. e12033. Used under a CC BY 2.0 licence.
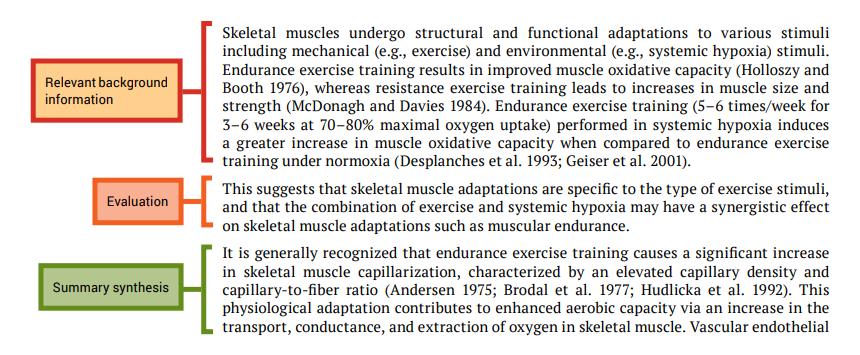
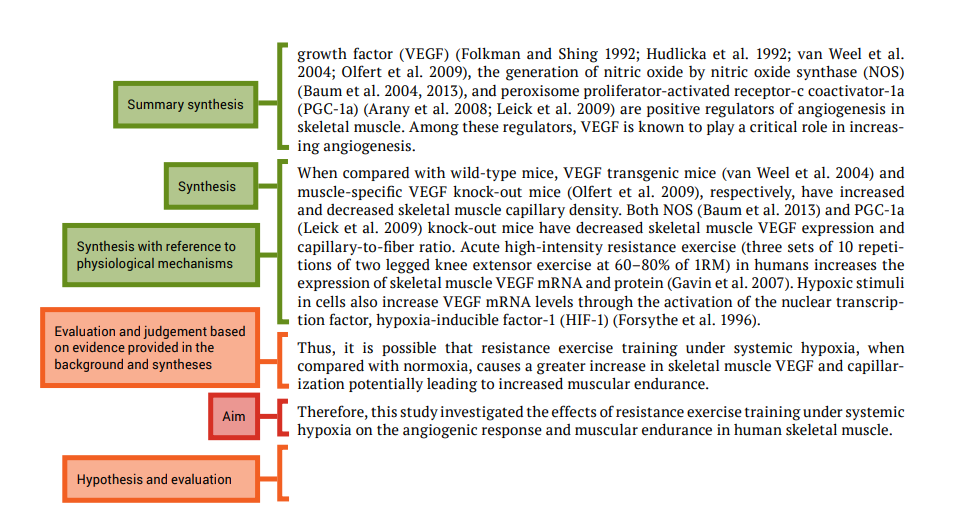
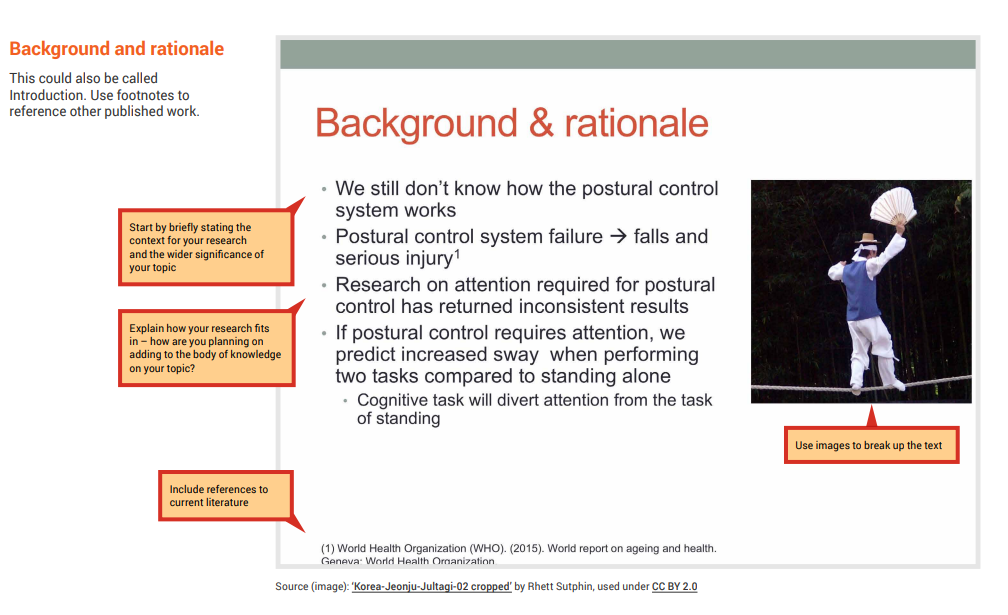
Introduction
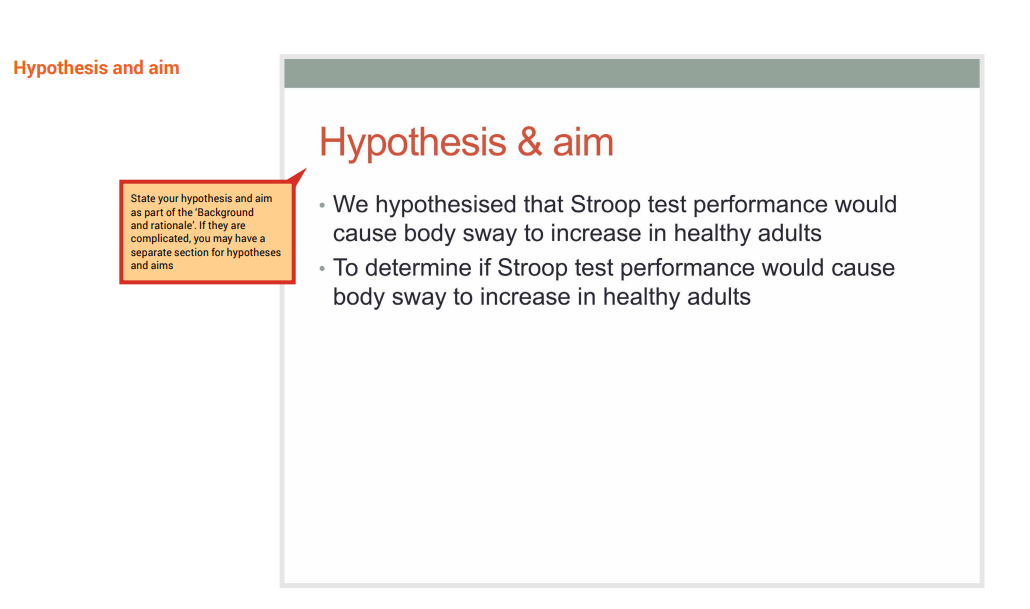
The introduction should establish the context and importance of the research. You may state your hypotheses and aims in the introduction; see Chapter 2 for tips on writing these statements.

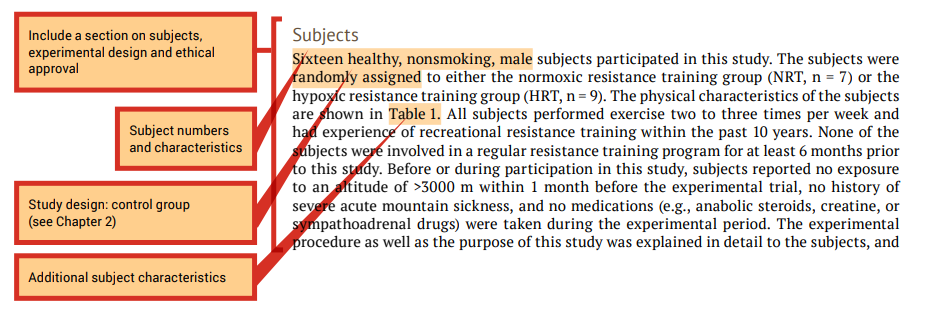
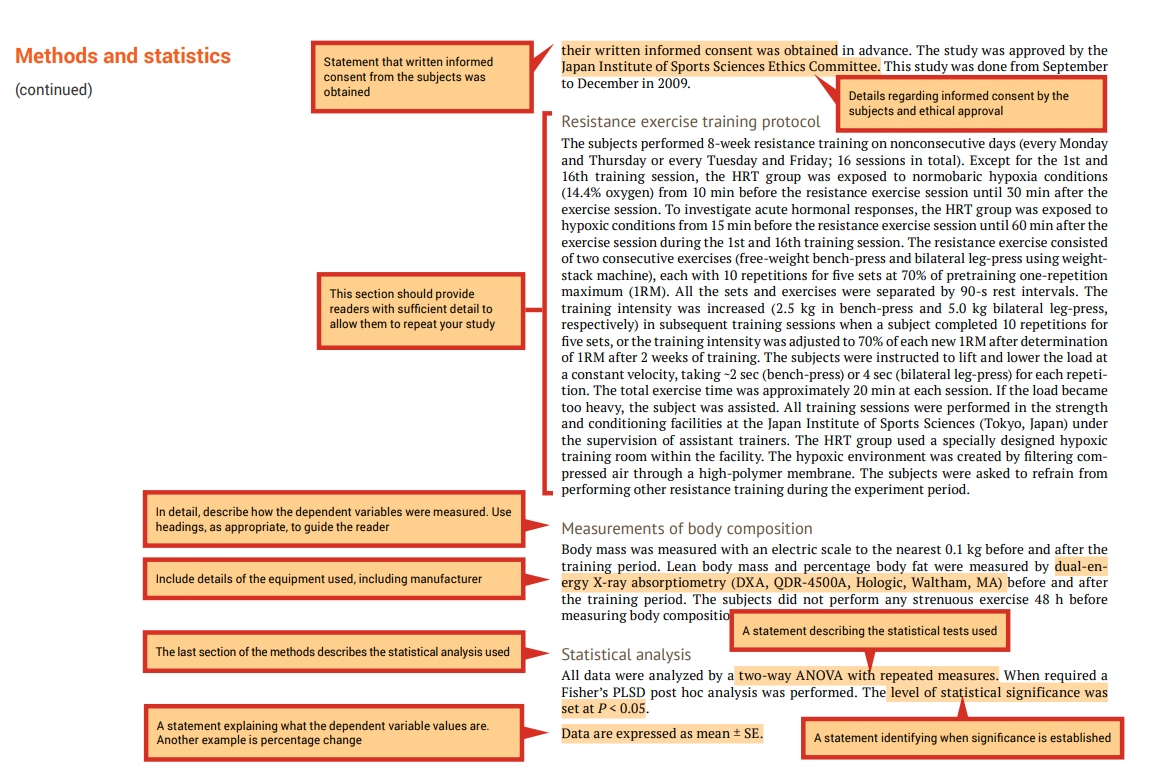
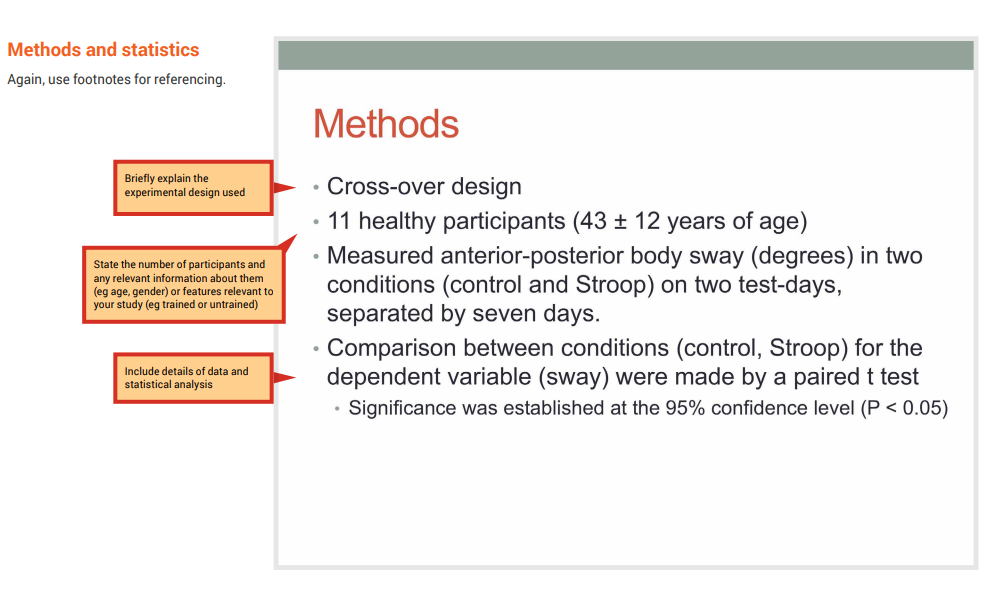
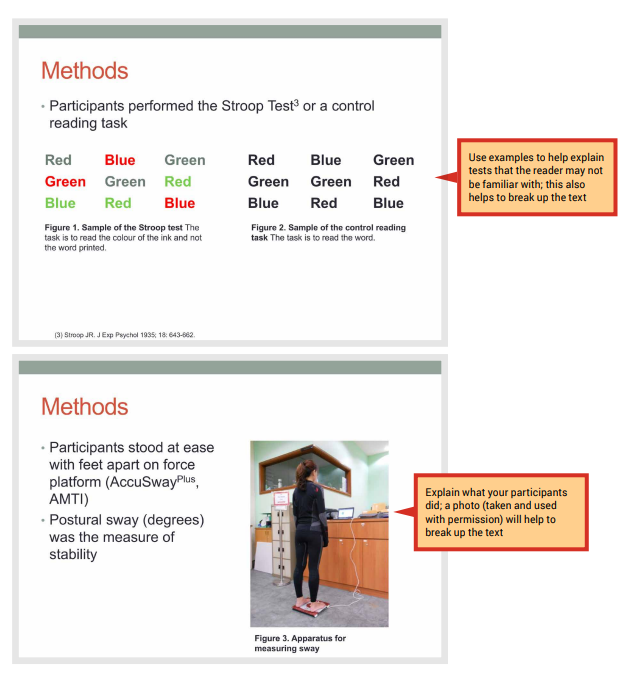
Methods and statistics
In the Methods and statistics section, you explain clearly how you carried out your study. The importance of providing sufficient information in this section was discussed in Chapter 1.
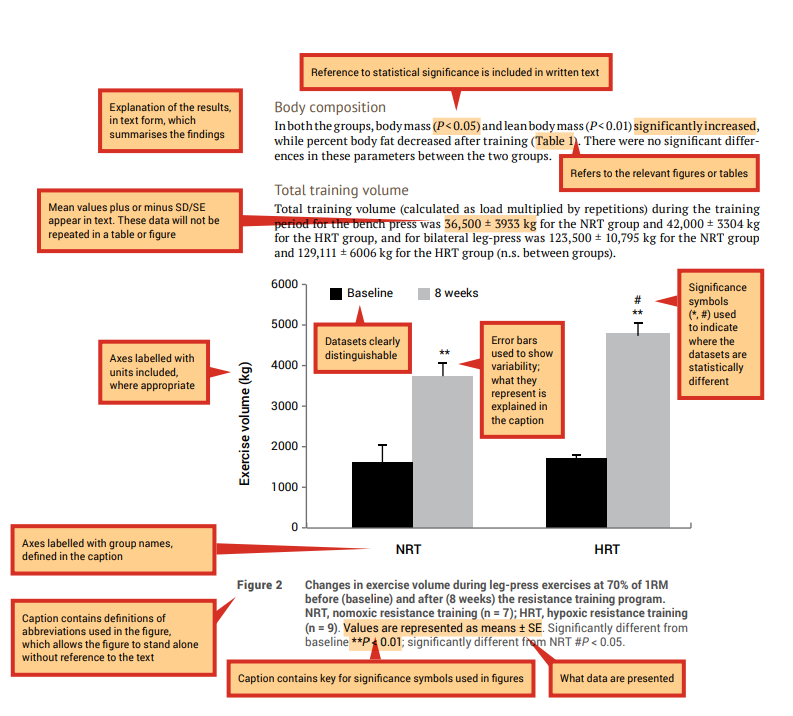
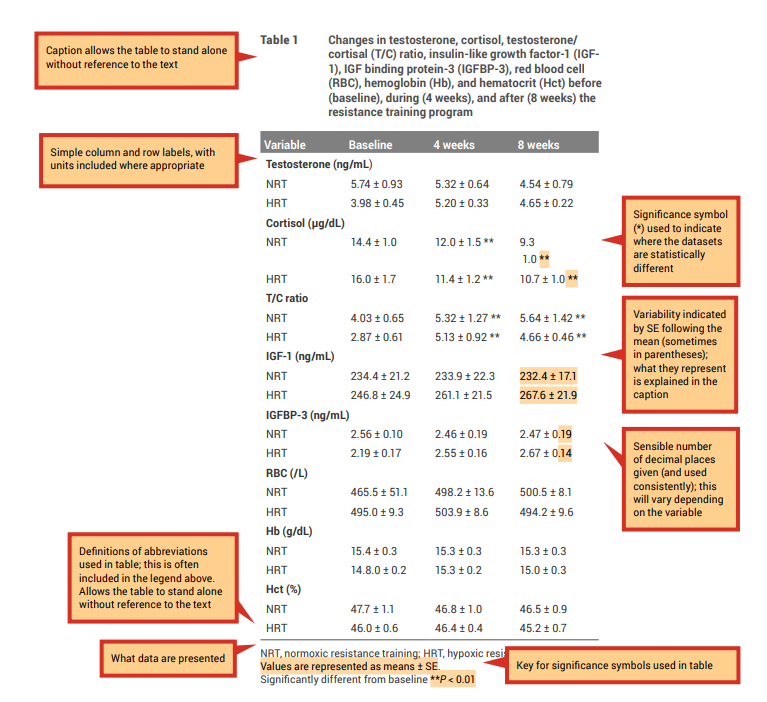
Results
Results appear in written form, supported by figures and tables, as appropriate. Examples of how to present all three forms of results are provided below. Chapter 3 and Chapter 4 provide details on conducting statistical tests, and creating figures and tables.
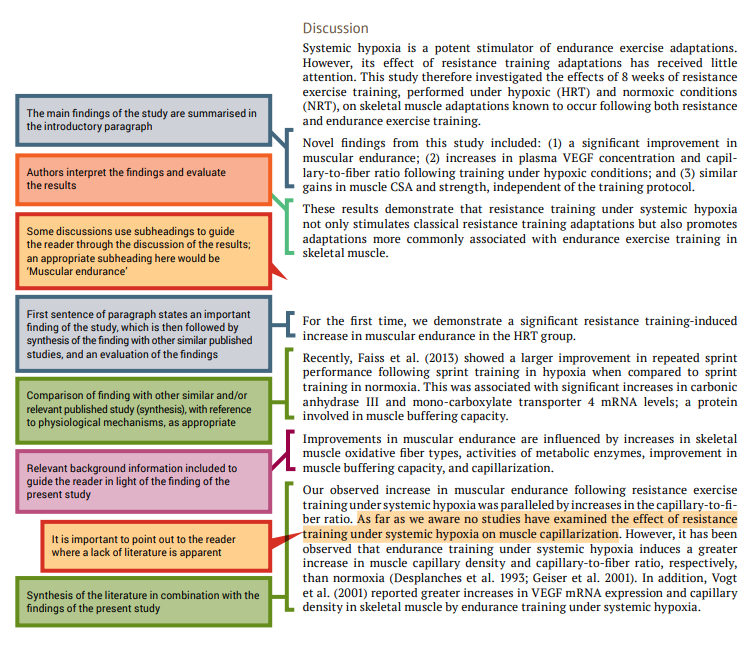
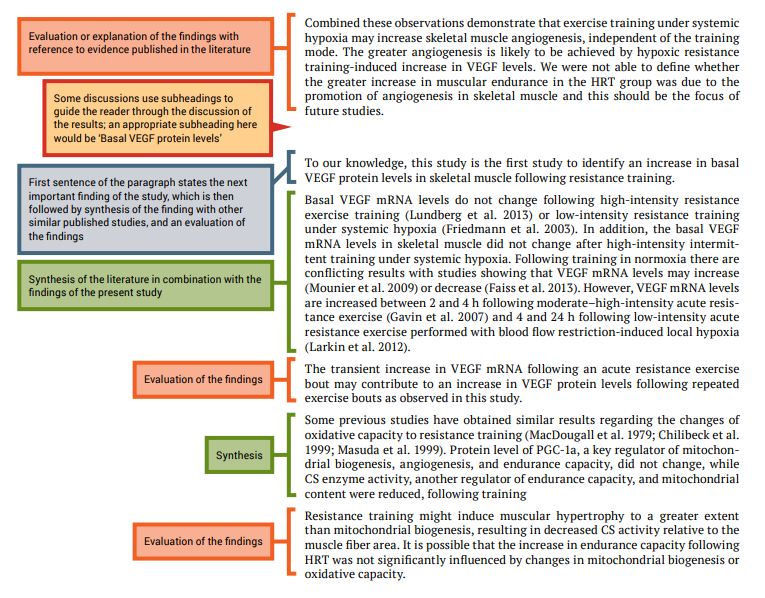
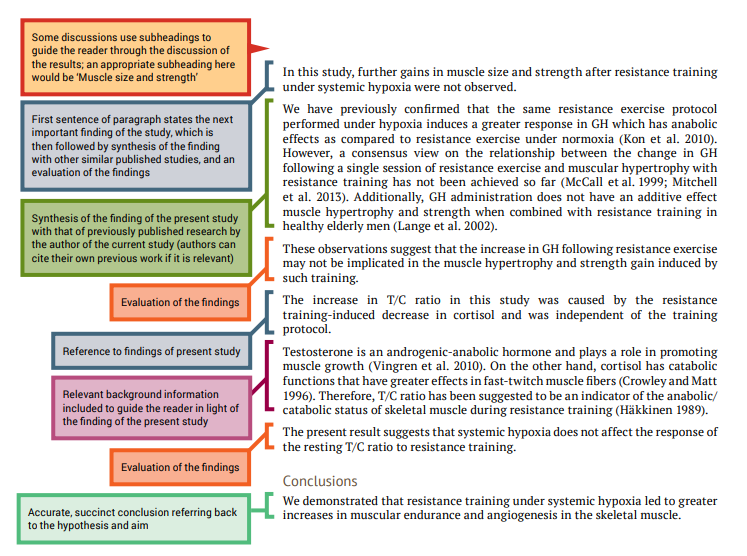
Discussion and conclusion
The function of the Discussion is to interpret your results in light of what was already know about the topic, and to explain our new understanding of the issue after taking your results into consideration.
The Discussion connects to the Introduction by way of the questions or hypotheses, and the literature that you cited. It does not simply repeat or rearrange the Introduction. Instead, it tells how your study has moved us forward from the place you left the reader at the end of the Introduction. See Chapter 2 for tips on writing a conclusion.
References
The reference section provides a list of the references that you cited in the body of your original investigation research article. The format will depend on the journal, as each journal has their own specific referencing format (see Chapter 5 for more about types of referencing formats).
It is important to accurately cite references in research papers to acknowledge your sources and ensure credit is appropriately given to authors of work you have referred to. An accurate and comprehensive reference list also shows your readers that you are well read in your topic area and are aware of the key papers that provide the context to your research.
In the research article by Kon et al. (2014) used as an example in this chapter, the reference list contains 34 items – imagine how much help referencing software would be. Chapter 5 provides support for using EndNote, an example of reference management software.
6.2 Poster presentation
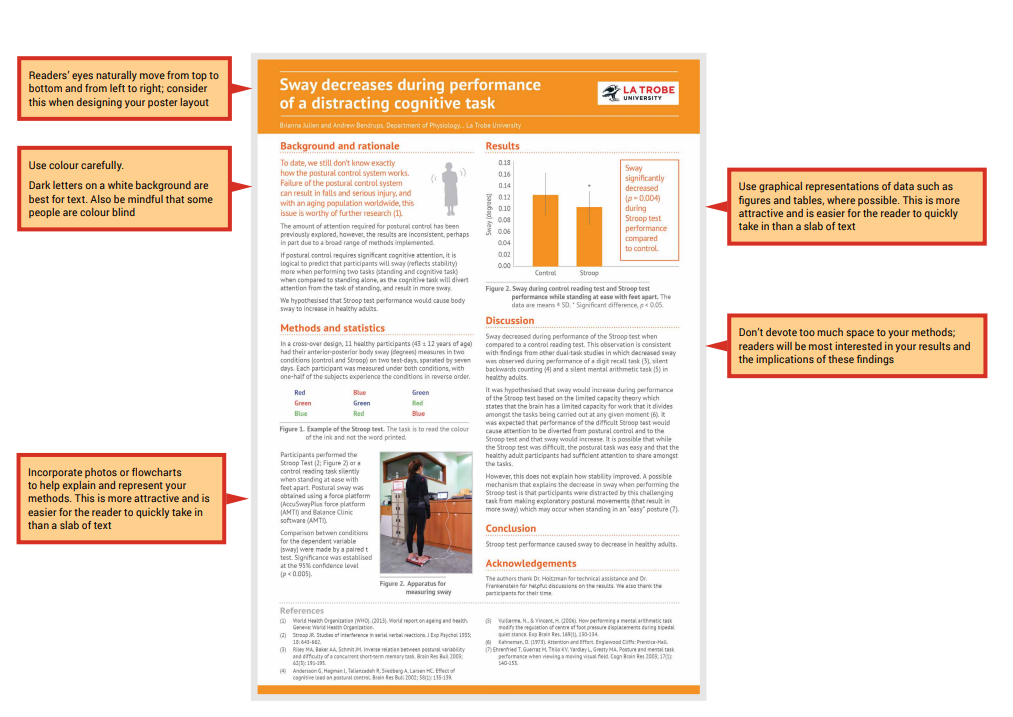
Scientific posters summarise research concisely and attractively to help publicise it and generate discussion when presented at scientific conferences.
Posters are presented at scientific conferences, and include brief text mixed with tables and/or graphs, and other presentation formats. A room will be setup with posters displayed on poster boards and times will be set aside for attendees to view the posters while their authors standby to answer questions and discuss their research.
The most important thing to remember when writing a poster is to keep things concise. A very wordy poster will be hard for a viewer to read, as the conference organisers will give you a maximum poster size you can display.
The hardest part about creating a poster is cutting out any information that is not strictly necessary; this takes time and possibly a number of drafts.
When creating a poster, you are stepping through a similar process to the process of writing up your research in research article format – however, with much less detail.
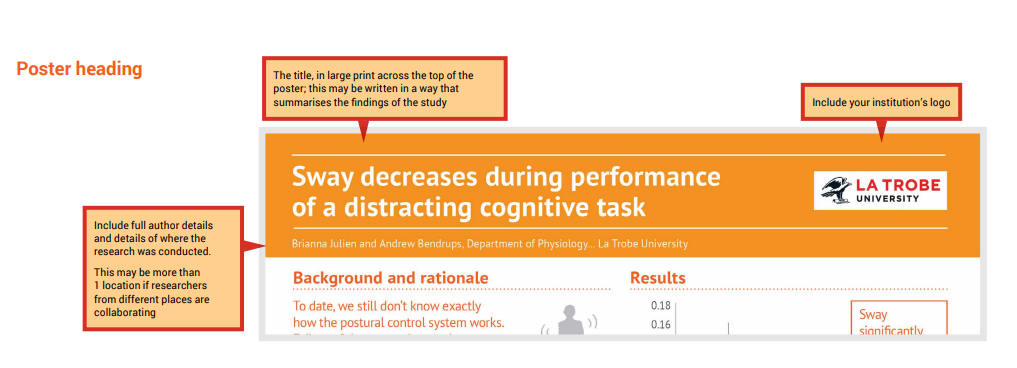
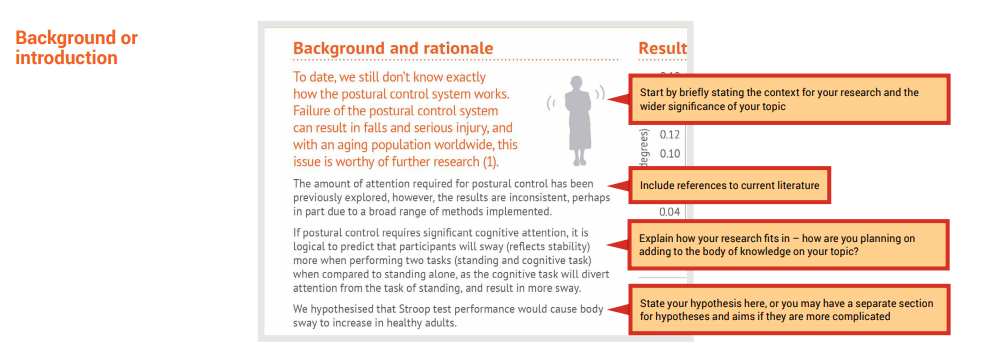
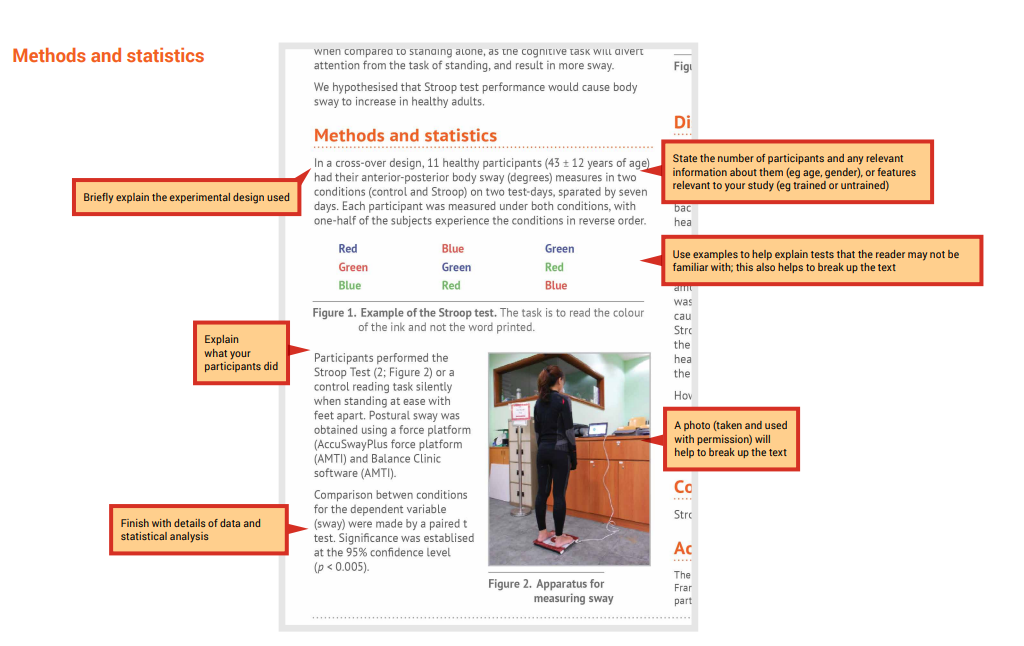
This section provides an example of a poster that presents an overview of an original investigation. We will also look at each section of the poster, and highlight important features of the format of the poster.
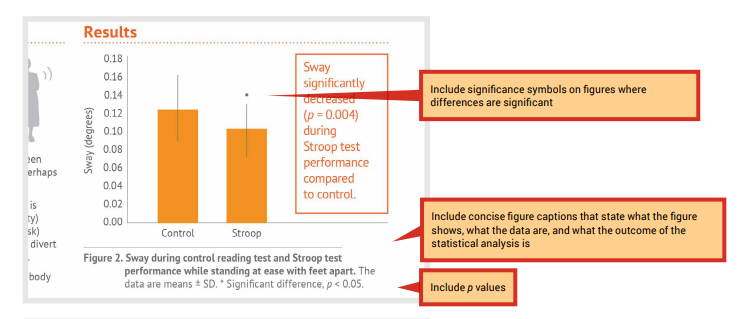
Results
Remember to state your results only briefly the in text. Where appropriate, support this description with a figure or table.
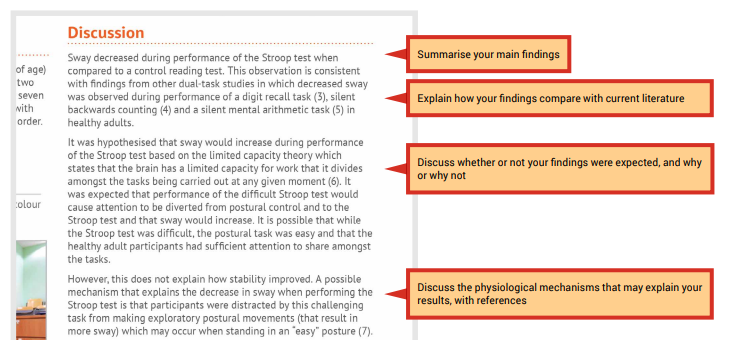
Discussion
Keep this short, but make sure you still explain the following points:
- How do your findings compare with what has been done previously in similar research?
- How do your results fit with your hypothesis – were your findings expected? Why or why not?
- What physiological mechanism do you propose to explain the findings?
Conclusion
 Keep the conclusion concise. We suggest using the schema introduced in Chapter 2 to write a short, direct conclusion that is consistent with your hypotheses and aims
Acknowledgments
 The acknowledgements section is an optional chance to thank people who contributed to your poster, including during the planning, data collection, analysis and presentation phase.
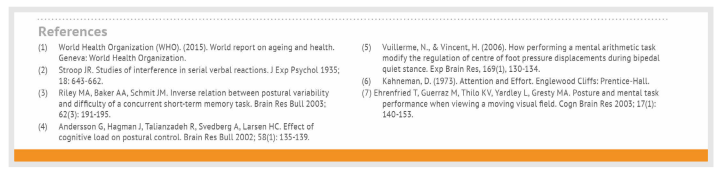
References
Keep your reference list as short as possible. Ensure your in-text citations are consistent with the reference list.
6.3 Oral communication
A scientific oral communication is a prepared, purposeful presentation designed to share your research work with other scientists. Here, you try to convince your audience that your research is valid and important.
Oral communications are often given at scientific conferences and are usually followed by questions from fellow scientists in the audience (Figure 6.3).
Similar to a poster presentation, the challenge of an oral communication is keeping things concise. You will have a limited opportunity to present the outcomes of your original investigation, so you want to spend this time focused on the most important aspects of the project – particularly the results and the implications of these findings.
Video 6.1: How to prepare an oral research presentation [4 mins, 09 secs]
The Undergraduate Research Office at Michigan State University created this video called How To Prepare an Oral Research Presentation.
Note: Closed captions are available by selecting the CC button below.
Most students will agree that oral communications are one of the most stressful tasks you will undertake during your degree. As a student scientist, you will have spent hours engaging with live and recorded lecture presentations and will have experienced many different types of presentations. As a result, you know what it is like to be an audience member. What kept you engaged? Consider the good and not so good lectures you have experienced as an audience member as you prepare your presentation. Try to embody the presenters that you enjoyed listening to.
When preparing your oral communication, you have three elements to consider:
- visual aids
- language use
- delivery.
Visual aids

Very wordy presentation slides will be hard for the audience to read and will be overwhelming. You will need to cut out any information that is not strictly necessary; this takes time and possibly a number of drafts.
Remember, you don’t need to include everything you are going to say on your slides. Rather, you should use the limited space on the slides to state key ideas and use these as prompts for your talk.
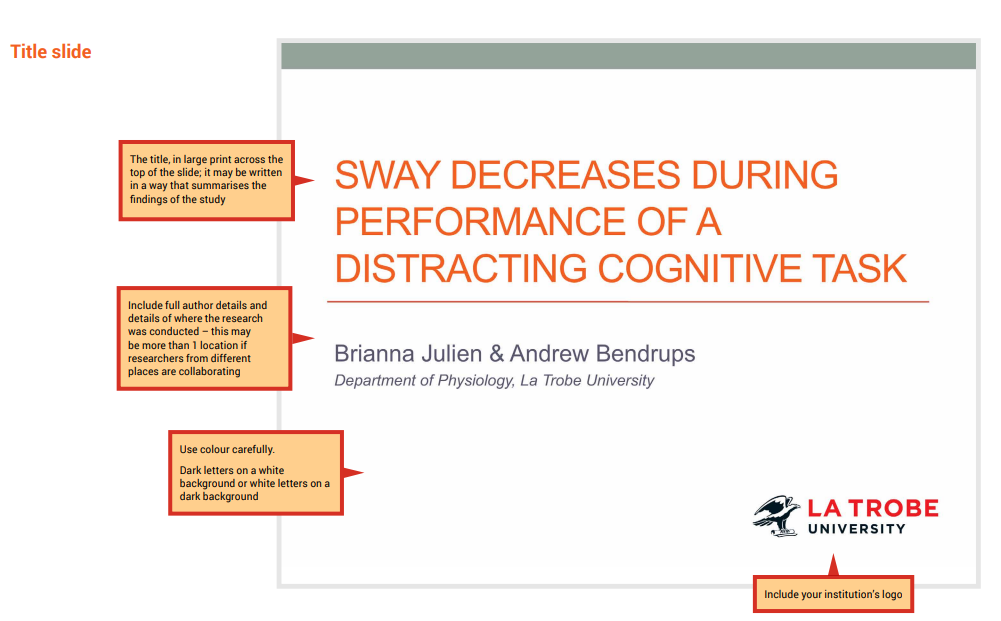
In a scientific oral communication, you should include slides for each of the major sections of a research article:
- introduction
- methods
- results
- discussio
- conclusion.
Given you have limited time, devote less time to your methods, and more to your results and discussion of the implications of your findings.
For your presentation slides, avoid large blocks of text. Try to break up the text you include using bullet points and also images where appropriate. Keep your presentation design simple – use dark fonts on a light background or light fonts on a dark background. Ensure that the font size is readable by your audience. Avoid overly distracting slide transitions or sound effects; these detract from your talk and may appear unprofessional.
Take the time to proofread your slides so there are no spelling or grammatical errors.
The following sections show an example of slides from an overview of an original investigation. We discuss each section of the presentation and highlight important features relating to the content of the slides. We also provide suggestions for how slides can complement your talk.
As an example of how to expanding on the concise text shown in your slides during your presentation, you could say ‘Each participant was measured under both conditions, with one-half of the subjects experiencing the conditions in reverse order’. Another example of how you could expand on the concise text shown on your slides during your presentation: ‘Each participant stood on the force plate for 1 minute trials’.
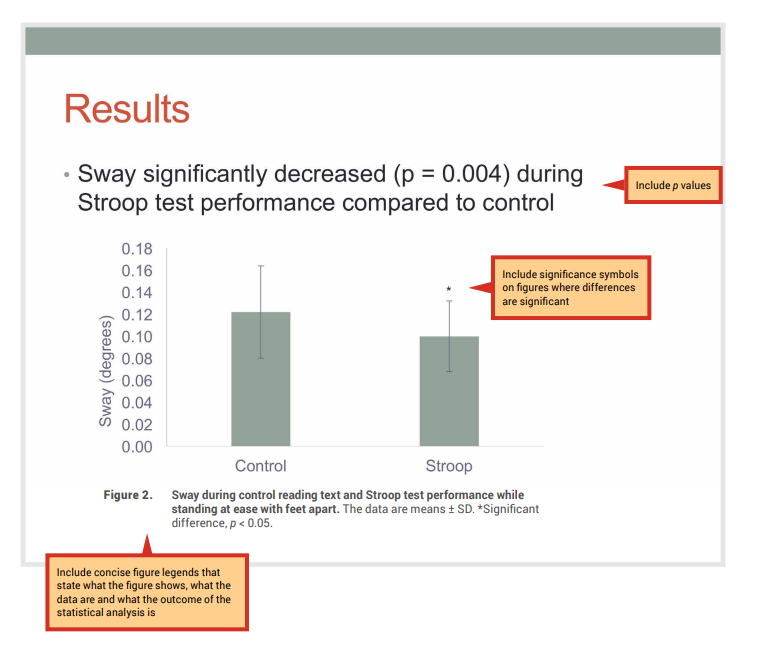
Results
You may choose to have separate Results and Discussion slides as in this example. Alternatively, where you have more than one major result to present, you may present each finding on a separate slide where you combine the Results and Discussion.
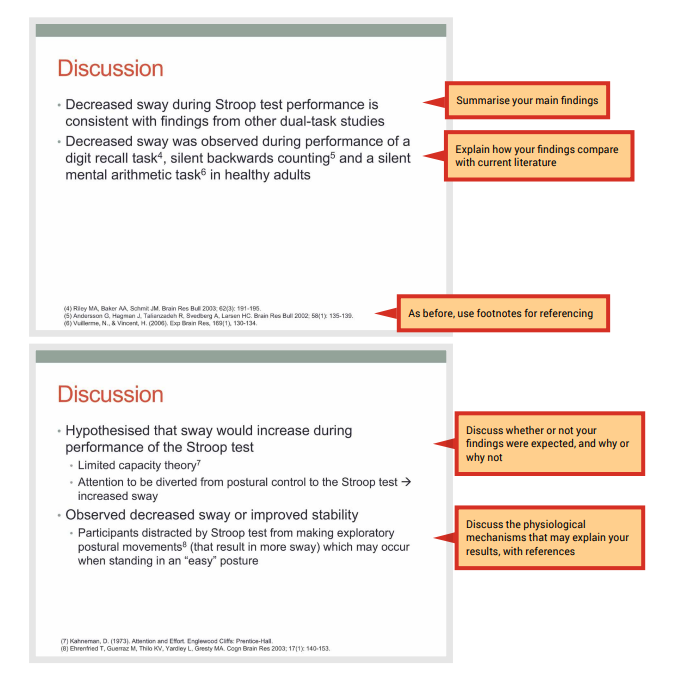
Discussion
Keep this short, but make sure you still explain the following points:
- How do your findings compare with what has been done previously in similar research?
- How do your results fit with your hypothesis? Were your findings expected? Why or why not?
- What physiological mechanism do you propose to explain the findings?
As before, use footnotes for referencing.
Conclusion
Keep the conclusion concise. We suggest using the schema introduced in Chapter 2 to write a short, direct conclusion that is consistent with your hypotheses and aims.
Language use
You may want to begin work on the delivery aspect of your presentation by writing a script, but keep in mind the written word is very different than the spoken word. Reading your script aloud, to yourself and to a practise audience, will allow you to hear your speech so you can judge whether the language is appropriate for a presentation.
Remember that the way we write and speak are very different.
Try to make language choices that are imaginative, memorable and compelling, and enhance the effectiveness of your presentation. Watch presentations by people you admire and study the way they use language to engage the audience.
Resource
Ted talks has 1000s of presentations that you can use for inspiration.
Remember to consider the level of expertise of your audience when deciding on the language to use.
Delivery
During your practise sessions, you can work on your delivery. A good presenter will be audible to everyone in the audience and will speak fluently, and not rely on notes. If you simply read your notes or presentation slides, it is very distracting to the audience. Practise will allow you to know your presentation well enough to leave the notes aside and speak to the audience.
Be conscious of your posture, use of gestures and eye contact, and vocal expressiveness. These elements will make your presentation compelling, and make you appear polished and confident.
Be aware of the time limit for your talk and be mindful of how close you are to the limit during your practice runs. You should make use of most or all of the allocated presentation time.
Remember to find out if there will be time allowed for questions after your talk, and ensure you consider this when preparing your presentation.
Further reading
Sahay, A., & Thangavelu, A. (2021). Presentations In Academic Success. https://usq.pressbooks.pub/academicsuccess/chapter/presentations/
Click the drop down below to review the terms learned from this chapter.
Copyright note:
- Content from the annotated article is from Kon, M, Ohiwa, N, Honda, A, Matsubayashi, T, Ikeda, T, Akimoto, T, Suzuki, Y, Hirano, Y & Russell, A 2014, ‘Effects of systemic hypoxia on human muscular adaptations to resistance exercise training’, Physiological Reports, vol. 2, p. e12033. Used under a CC BY 2.0 licence.
- The posters in this chapter are from How to Do Science version 1.1 by La Trobe University used under a CC-BY-NC-SA 4.0 licence.
references
Kon, M., Ohiwa, N., Honda, A., Matsubayashi, T., Ikeda, Tatsuaki., Akimoto, T., Suzuki, Y., Hirano, Y., & Russell, A.P. (2014) Effects of systemic hypoxia on human muscular adaptations to resistance exercise training. Physiological Reports, 2(6).
The Physiological Society. (2016). Guidelines for writing a key points summary: Information for authors. Retrieved August 24, 2016 from http://jp.msubmit.net/html/Keypoints_Guidelines.pdf.
